| Indicator | 2000 | 2006 | 2010 | 2019 | 2021 | 2022 |
|---|---|---|---|---|---|---|
| Population | ||||||
| Born in New York State | 50.3% | 49.6% | 49.5% | 48.5% | ||
| Disabled population | 6.4% | 6.0% | 7.8% | |||
| Foreign-born population | 37.8% | 37.8% | 37.8% | 35.4% | 35.6% | |
| Population | 2,465,326 | 2,508,820 | 2,508,340 | 2,559,903 | 2,641,052 | |
| Population aged 65+ | 11.5% | 12.0% | 11.5% | 14.4% | 15.1% | |
| Households | ||||||
| Households with children under 18 years old | 38.2% | 34.7% | 34.2% | 29.8% | 27.2% | |
| Single-person households | 29.7% | 28.2% | 27.9% | 30.0% | ||
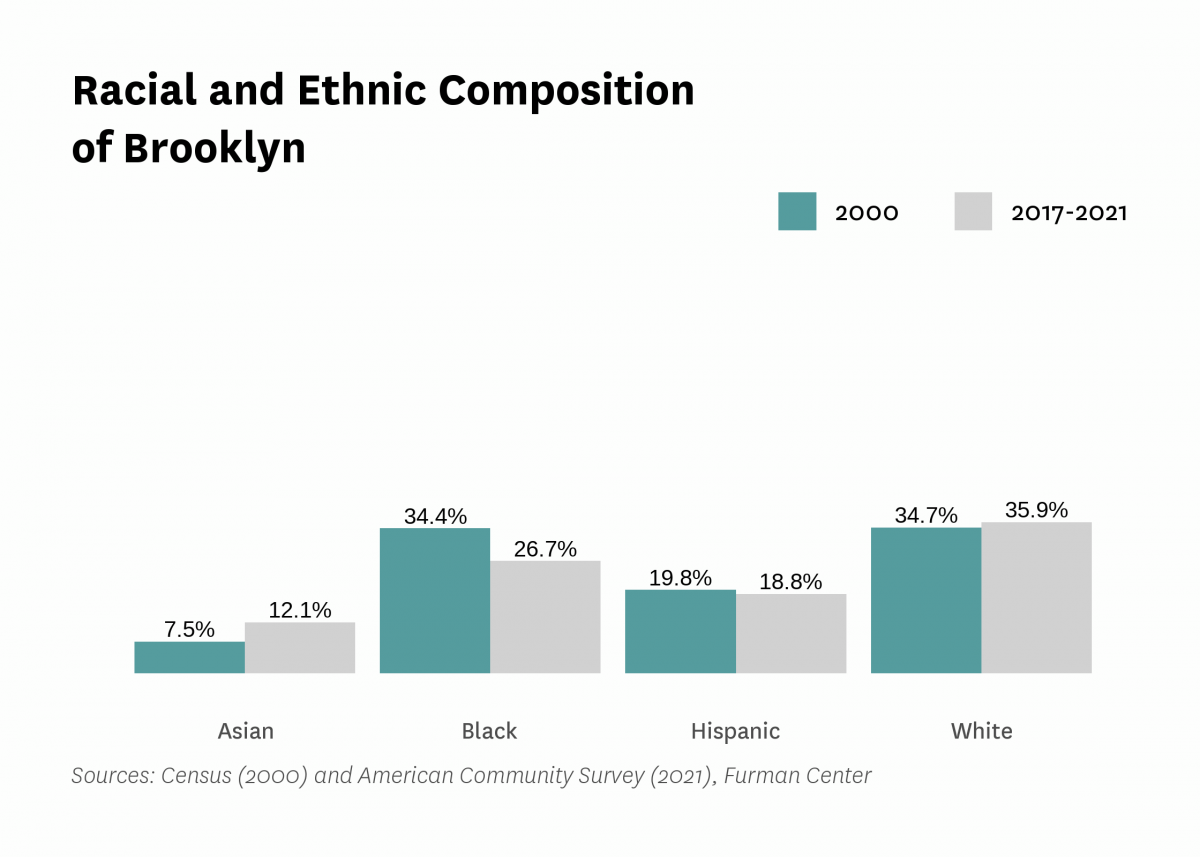
| Race and Ethnicity | ||||||
| Percent Asian | 7.5% | 9.0% | 10.5% | 11.9% | 12.1% | |
| Percent Black | 34.4% | 33.6% | 32.2% | 29.8% | 26.7% | |
| Percent Hispanic | 19.8% | 19.8% | 19.9% | 18.9% | 18.8% | |
| Percent white | 34.7% | 35.8% | 35.6% | 36.5% | 35.9% | |
| Racial diversity index | 0.72 | 0.71 | 0.72 | 0.73 | 0.75 | |
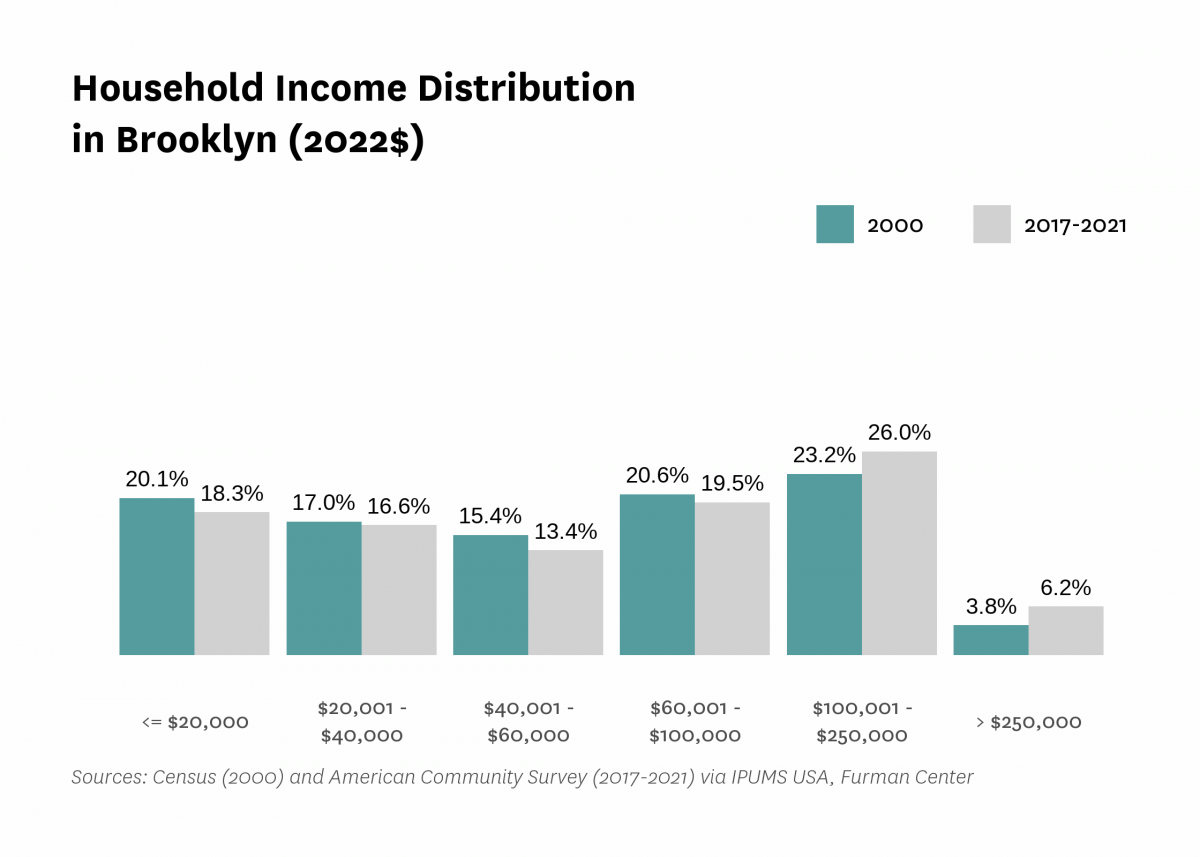
| Income and Poverty | ||||||
| Income diversity ratio | 6.3 | 5.7 | 6.4 | 6.7 | ||
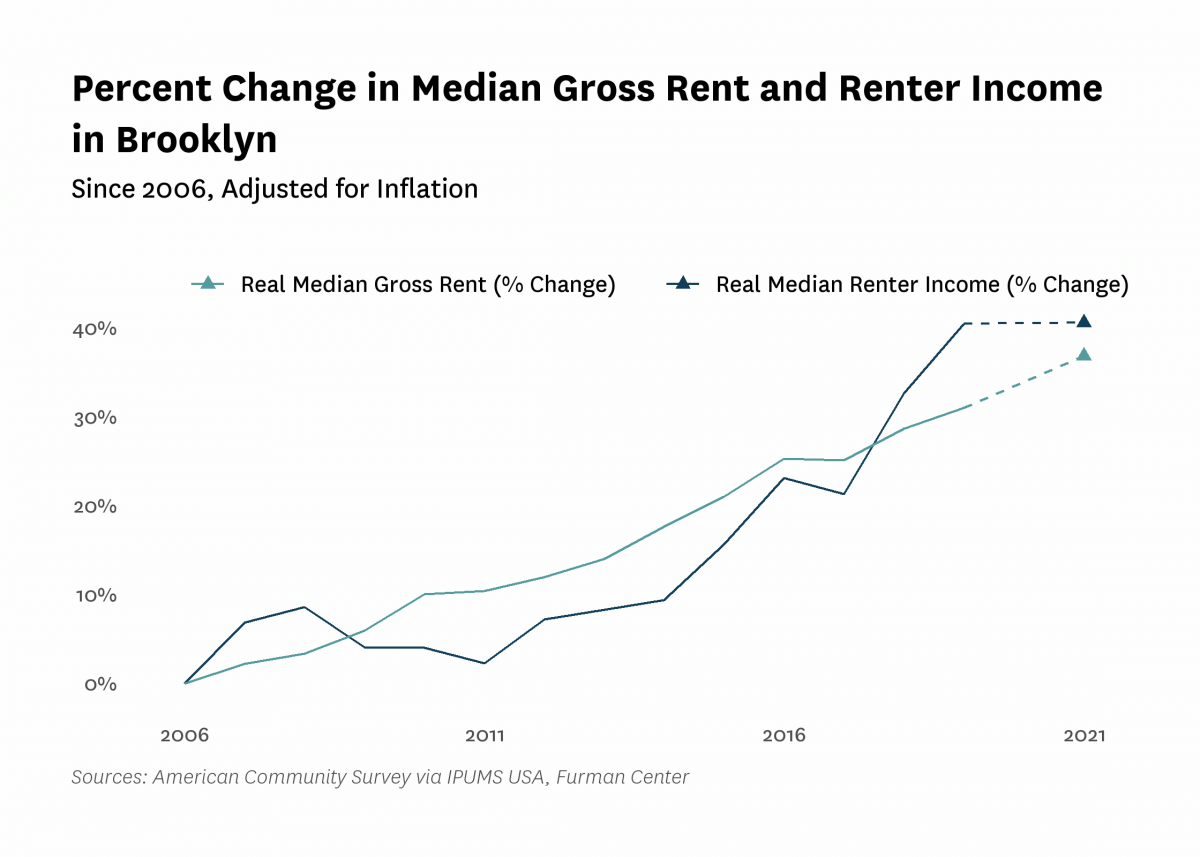
| Median household income (2022$) | $56,310 | $56,760 | $54,260 | $74,630 | $71,690 | |
| Median household income, homeowners (2022$) | $96,260 | $91,410 | $118,110 | $108,750 | ||
| Median household income, renters (2022$) | $41,840 | $43,530 | $58,780 | $58,840 | ||
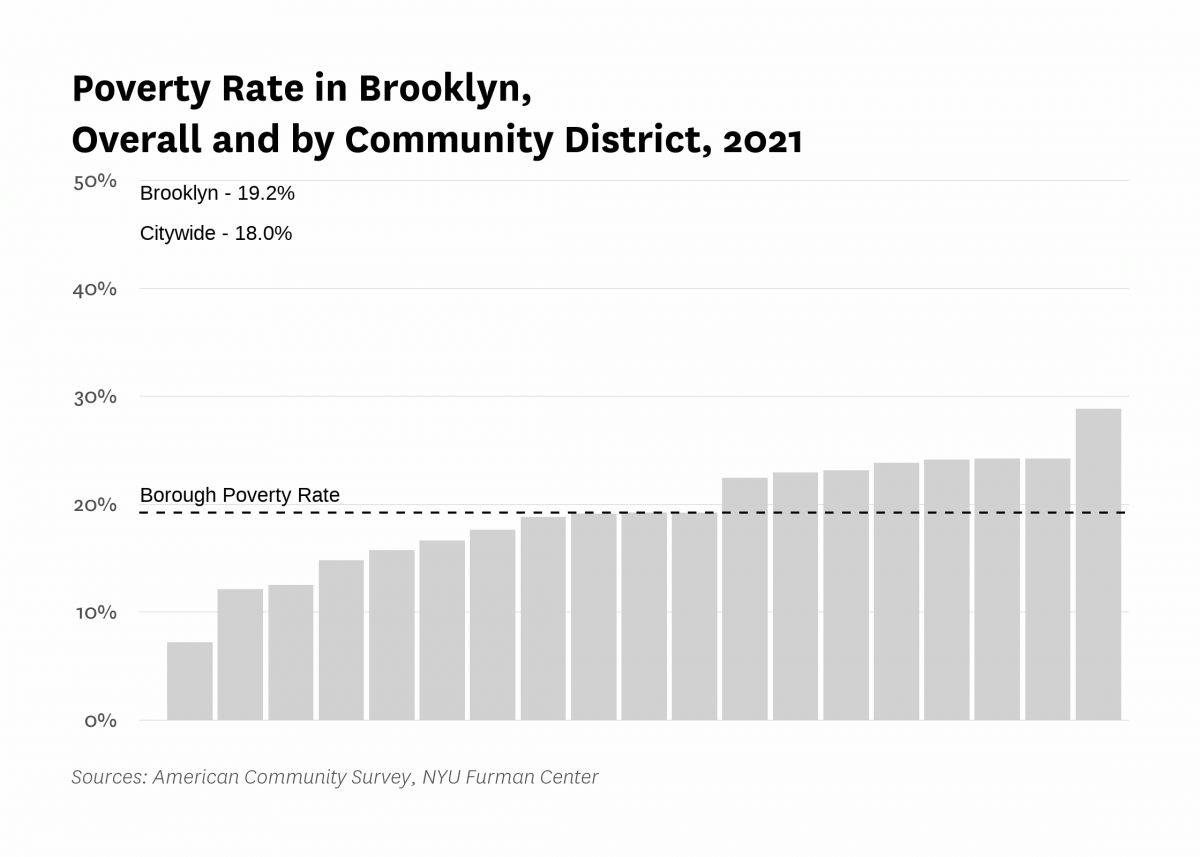
| Poverty rate | 25.1% | 22.6% | 23.0% | 17.7% | 19.2% | |
| Poverty rate, population aged 65+ | 24.2% | 20.6% | 20.6% | 20.3% | ||
| Poverty rate, population under 18 years old | 32.3% | 34.0% | 24.5% | 25.4% | ||
| Labor Market | ||||||
| Labor force participation rate | 59.3% | 61.6% | 63.9% | 63.8% | ||
| Population aged 25+ with a bachelor's degree or higher | 21.8% | 27.9% | 28.6% | 39.2% | 41.8% | |
| Population aged 25+ without a high school diploma | 22.6% | 21.6% | 16.2% | 15.4% | ||
| Unemployment rate | 10.74% | 7.38% | 10.86% | 4.54% | 11.17% | |
| Indicator | 2000 | 2006 | 2010 | 2019 | 2021 | 2022 |
|---|---|---|---|---|---|---|
| Housing Stock | ||||||
| Homeownership rate | 27.1% | 32.3% | 30.2% | 29.8% | 30.3% | |
| Housing units | 954,382 | 1,000,000 | 1,065,363 | 1,085,993 | ||
| Rental vacancy rate | 4.0% | 3.4% | 3.2% | |||
| Serious housing code violations (per 1,000 privately owned rental units) | 71.7 | 71.0 | 97.0 | 99.8 | 102.8 | |
| Severe crowding rate (% of renter households) | 4.4% | 4.6% | 4.7% | |||
| Total housing code violations (per 1,000 privately owned rental units) | 346.0 | 286.1 | 368.2 | 426.2 | 394.8 | |
| Finance - Distress | ||||||
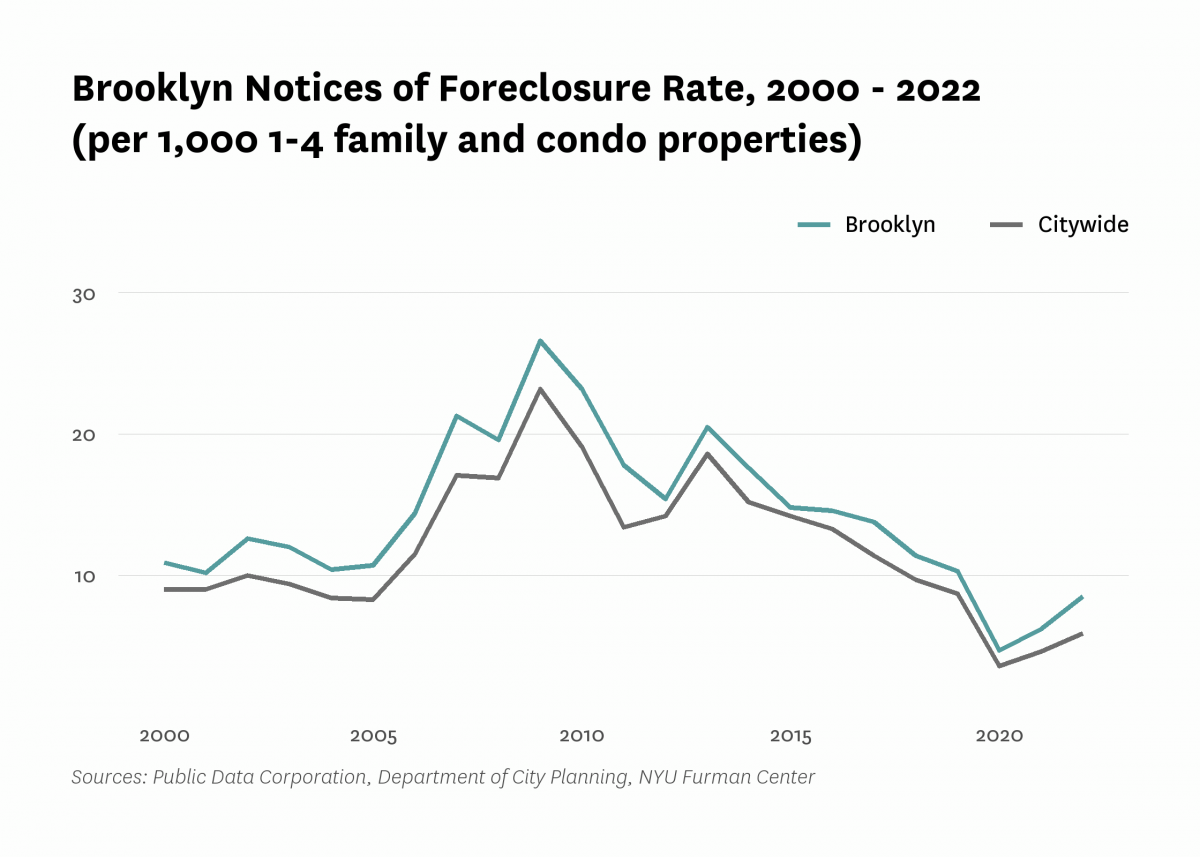
| Notices of foreclosure rate (per 1,000 1-4 family and condo properties) | 10.9 | 14.4 | 23.2 | 10.3 | 6.2 | 8.5 |
| Notices of foreclosure, all residential properties | 2,789 | 3,598 | 6,210 | 2,804 | 1,769 | 2,402 |
| Notices of foreclosure, initial, 1-4 family and condo properties | 1,769 | 2,677 | 3,632 | 1,146 | 492 | 872 |
| Notices of foreclosure, repeat, 1-4 family and condo properties | 484 | 568 | 1,951 | 1,448 | 1,081 | 1,320 |
| Pre-foreclosure notice rate (per 1,000 1-4 family and condo properties) | 48.6 | 20.8 | 44.9 | |||
| Pre-foreclosure notices, 1-4 family and condo properties | 12,220 | 5,362 | 11,573 | |||
| Properties entering REO, 1-4 family | 403 | 82 | 169 | |||
| Finance - Lending | ||||||
| FHA/VA-backed home purchase loans (% of home purchase loans) | 0.6% | 21.8% | 8.0% | 5.7% | ||
| Higher-cost home purchase loans (% of home purchase loans) | 27.3% | 0.9% | 5.4% | 2.8% | ||
| Higher-cost refinance loans (% of refinance loans) | 35.5% | 2.8% | 3.1% | 0.9% | ||
| Home purchase loan rate (per 1,000 properties) | 45.2 | 22.9 | 21.2 | 33.7 | ||
| Home purchase loans in LMI tracts (% of home purchase loans) | 49.2% | 8.9% | 30.3% | 30.2% | ||
| Home purchase loans to LMI borrowers (% of home purchase loans) | 3.9% | 38.4% | 5.6% | 6.3% | ||
| Refinance loan rate (per 1,000 properties) | 52.0 | 17.9 | 19.9 | 45.0 | ||
| Sales - Volume | ||||||
| Sales volume, 1 family building | 2,622 | 2,678 | 1,201 | 1,250 | 1,275 | 1,807 |
| Sales volume, 2-4 family building | 5,767 | 8,296 | 2,931 | 2,671 | 2,322 | 3,951 |
| Sales volume, 5+ family building | 597 | 1,003 | 494 | 356 | 448 | 585 |
| Sales volume, condominium | 644 | 2,734 | 3,068 | 2,516 | 4,046 | 3,300 |
| Sales volume, all property types | 9,630 | 14,711 | 7,694 | 6,793 | 8,091 | 9,643 |
| Sales - Median Prices | ||||||
| Median sales price per unit, 1 family building (2022$) | $382,370 | $667,500 | $643,810 | $852,940 | $901,870 | $860,000 |
| Median sales price per unit, 2-4 family building (2022$) | $199,960 | $372,390 | $311,600 | $485,560 | $529,980 | $526,000 |
| Median sales price per unit, 5+ family building (2022$) | $70,810 | $133,380 | $127,150 | $278,740 | $279,180 | $283,330 |
| Median sales price per unit, condominium (2022$) | $355,980 | $687,010 | $618,060 | $947,710 | $981,450 | $990,000 |
| Sales - Housing Price Index | ||||||
| Index of housing price appreciation, 1 family building | 100.0 | 215.5 | 190.4 | 301.7 | 346.1 | 350.5 |
| Index of housing price appreciation, 2-4 family building | 100.0 | 243.2 | 182.5 | 356.1 | 403.8 | 405.5 |
| Index of housing price appreciation, 5+ family building | 100.0 | 224.5 | 221.2 | 543.4 | 515.7 | 512.0 |
| Index of housing price appreciation, condominium | 100.0 | 217.4 | 193.0 | 341.8 | 356.1 | 374.4 |
| Index of housing price appreciation, all property types | 100.0 | 231.5 | 189.4 | 343.2 | 370.2 | 383.6 |
| Subsidized Housing | ||||||
| Total number of subsidized properties (properties) | 4,497 | |||||
| HUD Financing or Insurance (properties) | 128 | |||||
| HUD Financing or Insurance (units) | 6,305 | |||||
| HUD Project-based Rental Assistance Program (properties) | 312 | |||||
| HUD Project-based Rental Assistance Program (units) | 23,123 | |||||
| Low Income Housing Tax Credit (properties) | 789 | |||||
| Low Income Housing Tax Credit (units) | 36,350 | |||||
| Public Housing (properties) | 192 | |||||
| Public Housing (units) | 51,343 | |||||
| Mitchell-Lama (properties) | 87 | |||||
| Mitchell-Lama (units) | 24,577 | |||||
| 421-a Tax Exemption (properties) | 2,859 | |||||
| 421-a Tax Exemption (units) | 78,532 | |||||
| 420-c Tax Exemption (properties) | 803 | |||||
| 420-c Tax Exemption (units) | 24,100 | |||||
| NYC Housing Production Programs and Zoning Incentives or Requirements (properties) | 1,952 | |||||
| Eligible to expire from housing programs between 2023 and 2028 (properties) | 213 | |||||
| Eligible to expire from housing programs between 2023 and 2028 (units) | 7,259 | |||||
| Eligible to expire from housing programs between 2029 and 2038 (properties) | 286 | |||||
| Eligible to expire from housing programs between 2029 and 2038 (units) | 15,298 | |||||
| Eligible to expire from housing programs in 2039 and later (properties) | 545 | |||||
| Eligible to expire from housing programs in 2039 and later (units) | 39,451 | |||||
| Indicator | 2000 | 2006 | 2010 | 2019 | 2021 | 2022 |
|---|---|---|---|---|---|---|
| Density | ||||||
| Population density (1,000 persons per square mile) | 36.2 | 36.2 | 36.9 | 38.1 | ||
| Development | ||||||
| Units authorized by new residential building permits | 4,980 | 27 | 2,092 | 10,129 | 8,710 | 30,599 |
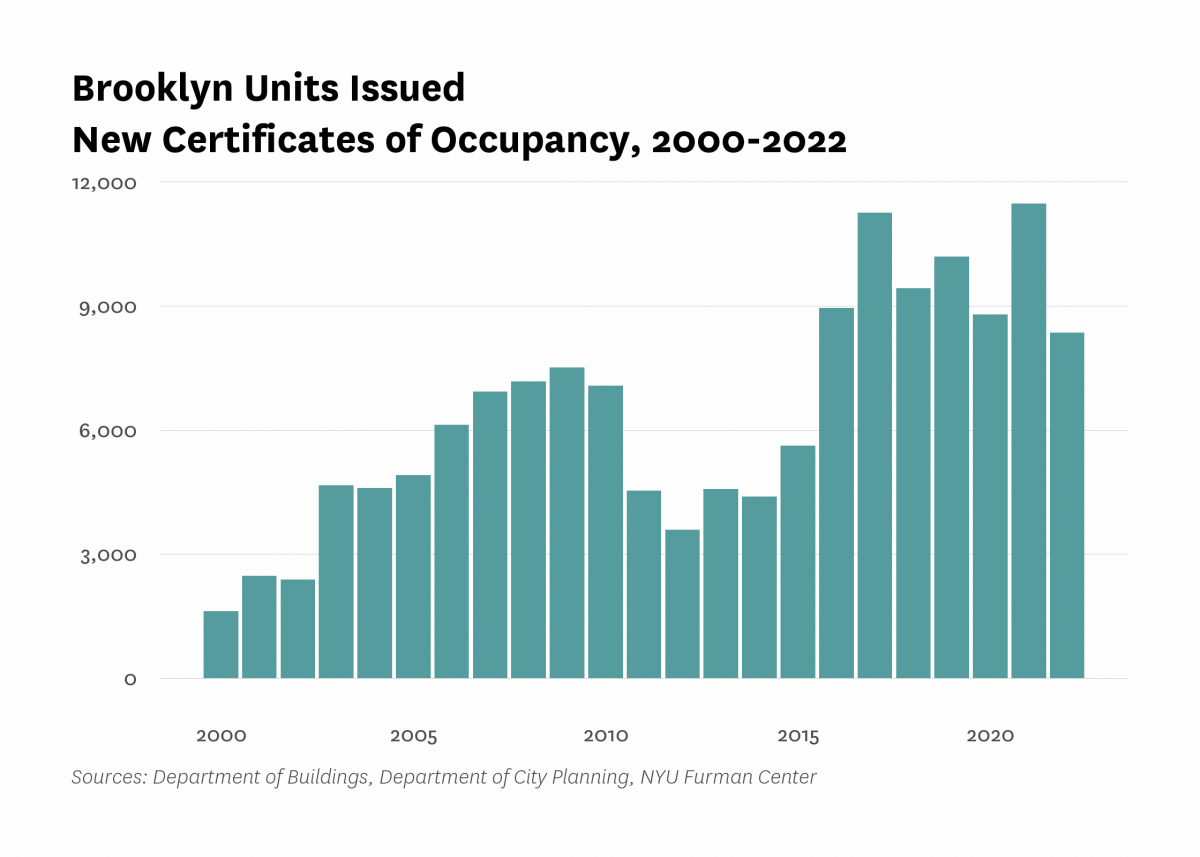
| Units issued new certificates of occupancy | 1,611 | 6,129 | 7,066 | 10,187 | 11,471 | 8,350 |
| Indicator | 2000 | 2006 | 2010 | 2019 | 2021 | 2022 |
|---|---|---|---|---|---|---|
| Commute | ||||||
| Car-free commute (% of commuters) | 67.6% | 71.3% | 74.4% | 74.9% | 66.4% | |
| Mean travel time to work (minutes) | 43.2 | 41.4 | 40.7 | 43.8 | 41.4 | |
| Crime and Incarceration | ||||||
| Serious crime rate (per 1,000 residents) | 22.9 | 15.8 | 13.2 | 10.9 | 10.3 | 12.2 |
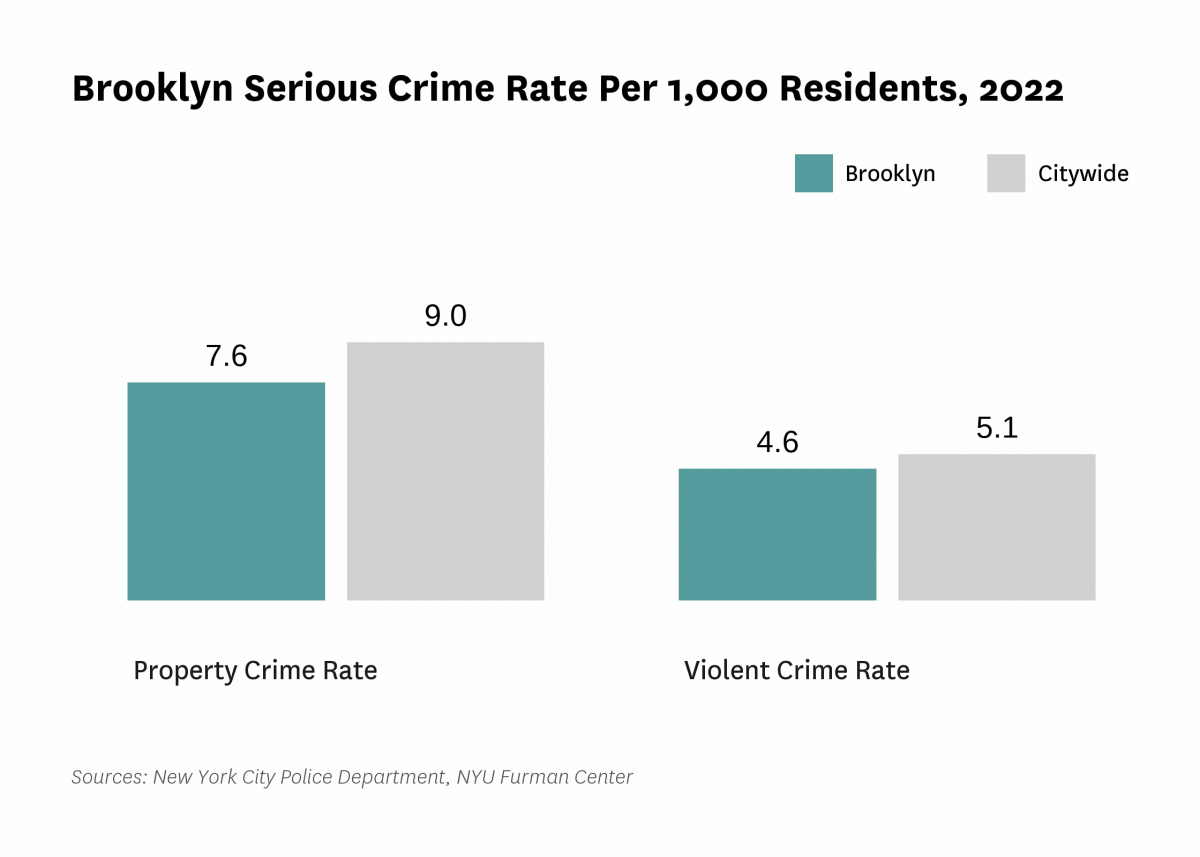
| Serious crime rate, property (per 1,000 residents) | 13.8 | 9.9 | 8.0 | 6.6 | 6.3 | 7.6 |
| Serious crime rate, violent (per 1,000 residents) | 9.1 | 5.9 | 5.2 | 4.3 | 3.9 | 4.6 |
| Schools | ||||||
| Students performing at grade level in English language arts, 4th grade | 51.2% | 47.1% | ||||
| Students performing at grade level in math, 4th grade | 52.3% | 46.2% | ||||
| Indicator | 2000 | 2006 | 2010 | 2019 | 2021 | 2022 |
|---|---|---|---|---|---|---|
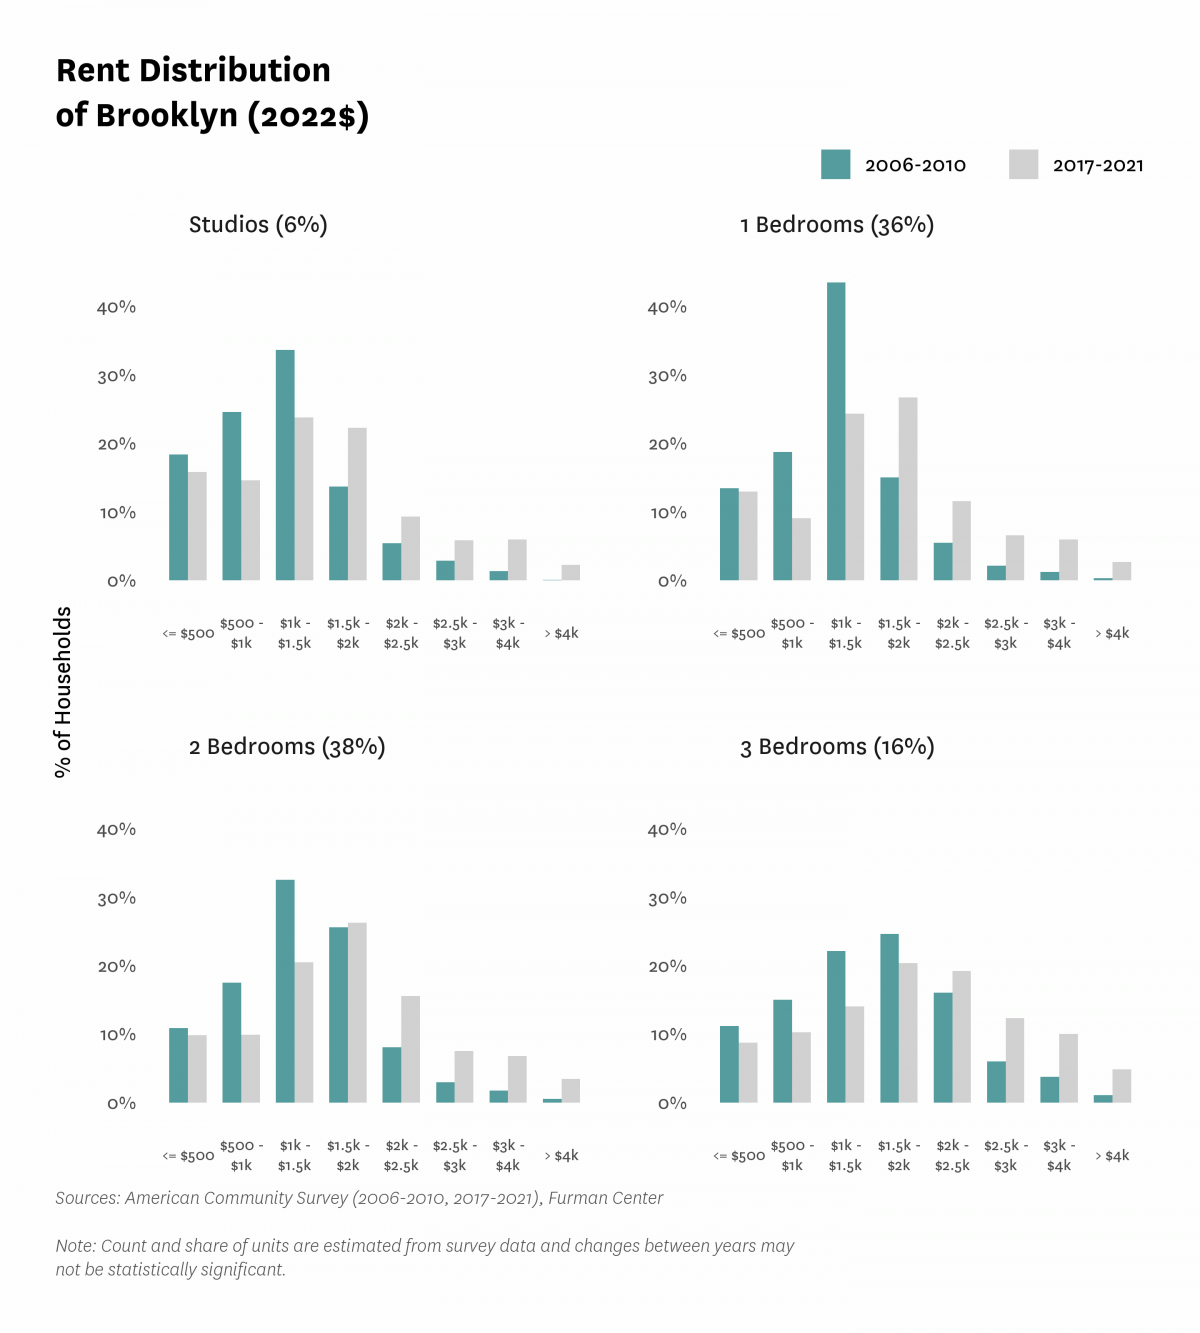
| Median Rent | ||||||
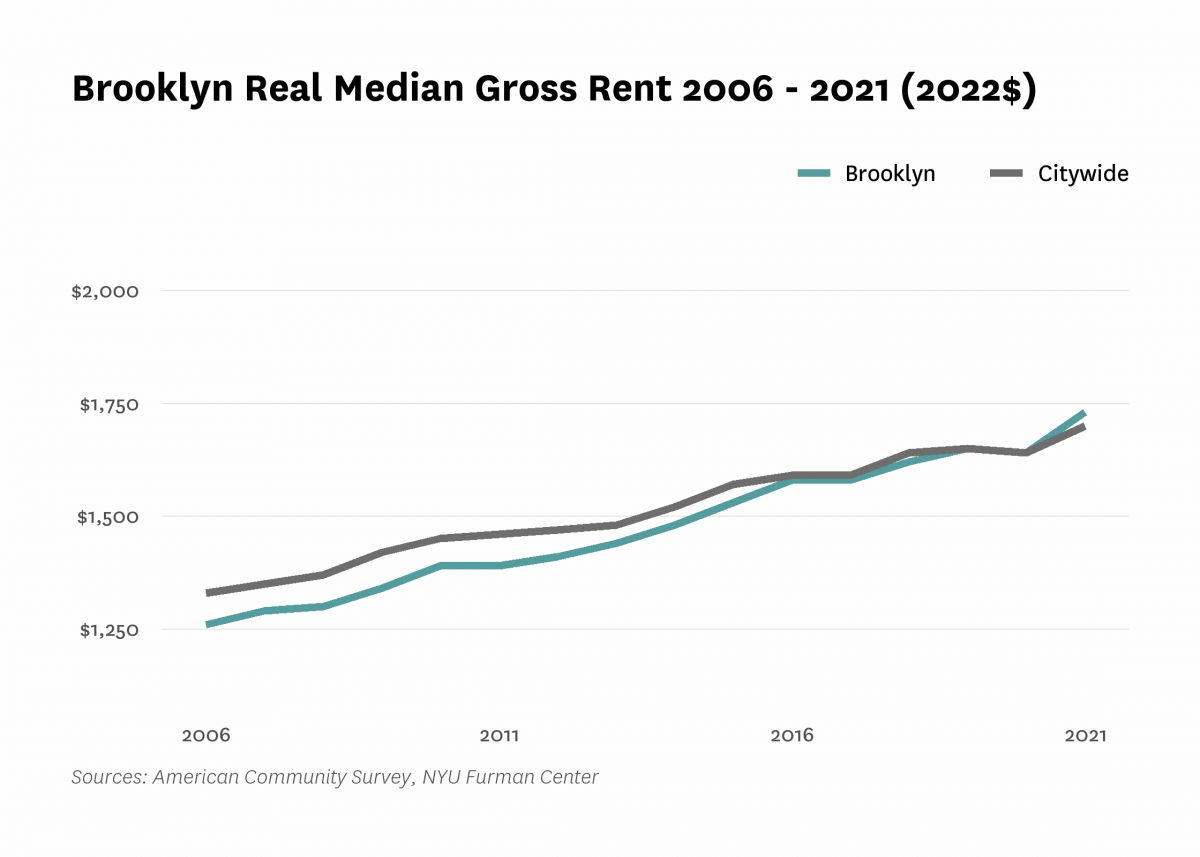
| Median rent, 2- and 3-bedrooms (2022$) | $1,410 | $1,650 | $1,770 | |||
| Median rent, all (2022$) | $1,140 | $1,260 | $1,390 | $1,650 | $1,730 | |
| Median rent, recent movers (2022$) | $1,610 | $2,060 | $2,330 | |||
| Median rent, studios and 1-bedrooms (2022$) | $1,220 | $1,430 | $1,550 | |||
| Affordability | ||||||
| Rental units affordable at 30% AMI (% of recently available units) | 7.7% | 7.5% | 7.0% | |||
| Rental units affordable at 80% AMI (% of recently available units) | 60.5% | 49.5% | 44.7% | |||
| Rental units affordable at 120% AMI (% of recently available units) | 90.0% | 82.3% | 79.1% | |||
| Rent Burden | ||||||
| Moderately rent-burdened households | 23.3% | 24.8% | 24.2% | 22.7% | ||
| Moderately rent-burdened households, low income | 30.2% | 30.4% | 30.2% | |||
| Moderately rent-burdened households, moderate income | 16.0% | 19.4% | 20.0% | |||
| Severely rent-burdened households | 26.5% | 29.3% | 29.4% | 28.4% | ||
| Severely rent-burdened households, low income | 43.0% | 44.4% | 44.1% | |||
| Severely rent-burdened households, moderate income | 1.1% | 1.6% | 2.0% | |||
| Rental Subsidy | ||||||
| Housing choice vouchers (% of occupied, privately owned rental units) | 7.8% | 6.3% | ||||
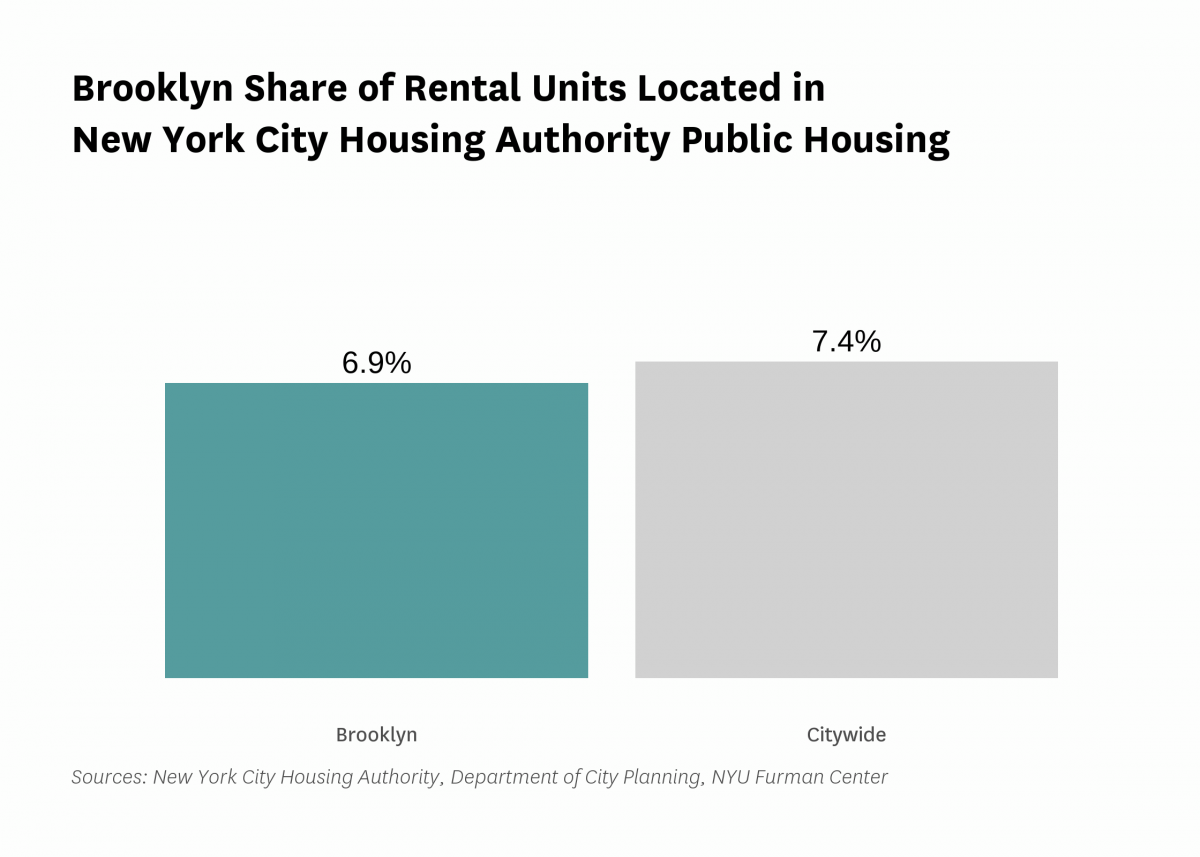
| Public housing (% of rental units) | 6.9% | |||||
Data Notes: See CoreData User Guide for more information about indicator definitions and methods.
Indicators: The rental vacancy rate, severe crowding rate, and the severely rent-burdened households indicators use five-year American Community Survey (ACS) estimates. Data under the 2010 heading comes from the 2006 – 2010 ACS, data under the 2019 heading comes from the 2015 – 2019 ACS and data under the 2021 heading comes from 2017 – 2021 ACS .
All content © 2005 – 2024 Furman Center for Real Estate and Urban Policy | Top of page | Contact Us