| Indicator | 2000 | 2006 | 2010 | 2019 | 2021 | 2022 |
|---|---|---|---|---|---|---|
| Population | ||||||
| Born in New York State | 60.5% | 58.9% | 64.6% | 68.4% | ||
| Disabled population | 8.1% | 4.6% | 5.7% | |||
| Foreign-born population | 39.8% | 33.9% | 35.9% | 26.5% | 23.8% | |
| Population | 158,548 | 155,509 | 168,915 | 153,470 | 172,253 | |
| Population aged 65+ | 13.2% | 11.0% | 9.3% | 11.9% | 11.5% | |
| Households | ||||||
| Households with children under 18 years old | 41.1% | 41.1% | 45.5% | 44.0% | 43.9% | |
| Single-person households | 26.5% | 18.0% | 18.1% | 20.9% | ||
| Race and Ethnicity | ||||||
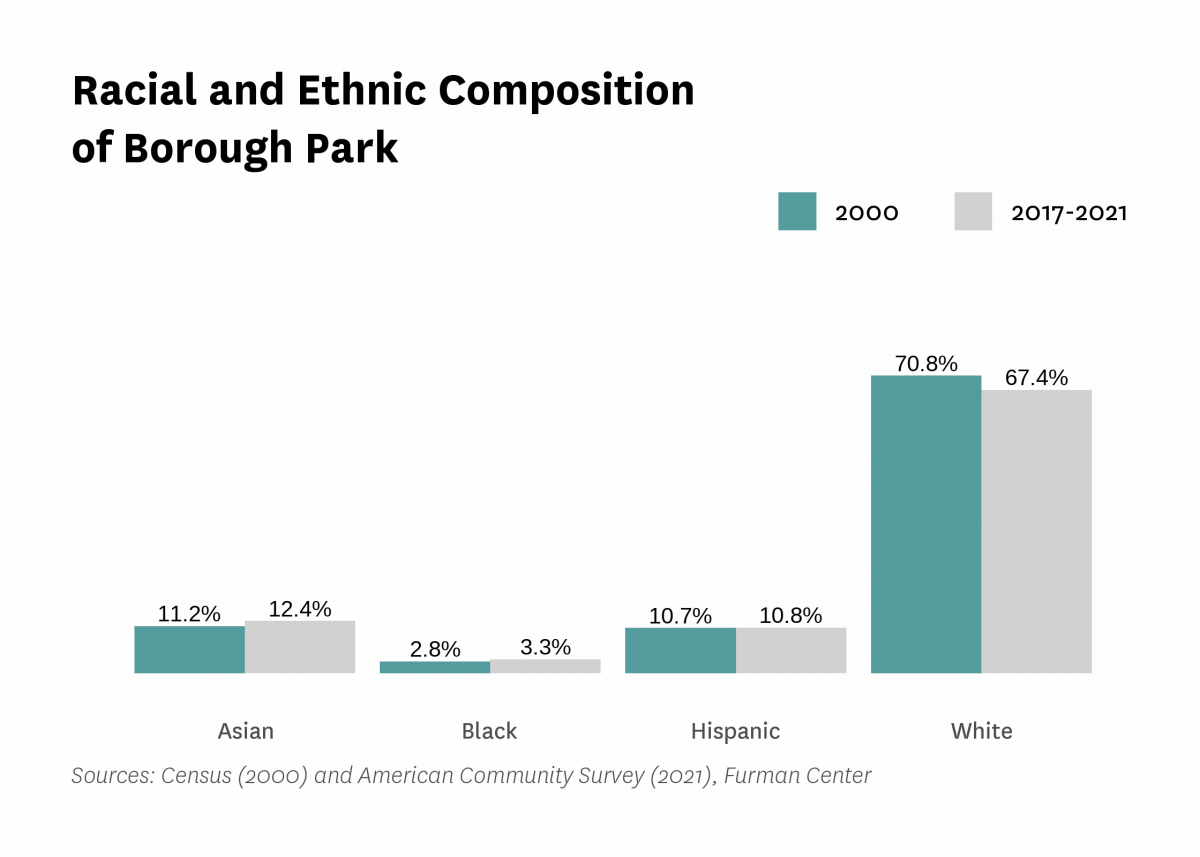
| Percent Asian | 11.2% | 13.4% | 16.3% | 12.7% | 12.4% | |
| Percent Black | 2.8% | 2.9% | 1.5% | 1.5% | 3.3% | |
| Percent Hispanic | 10.7% | 10.9% | 10.0% | 10.5% | 10.8% | |
| Percent white | 70.8% | 70.6% | 71.0% | 72.1% | 67.4% | |
| Racial diversity index | 0.47 | 0.47 | 0.46 | 0.45 | 0.52 | |
| Income and Poverty | ||||||
| Income diversity ratio | 4.9 | 4.8 | 5.6 | 5.5 | ||
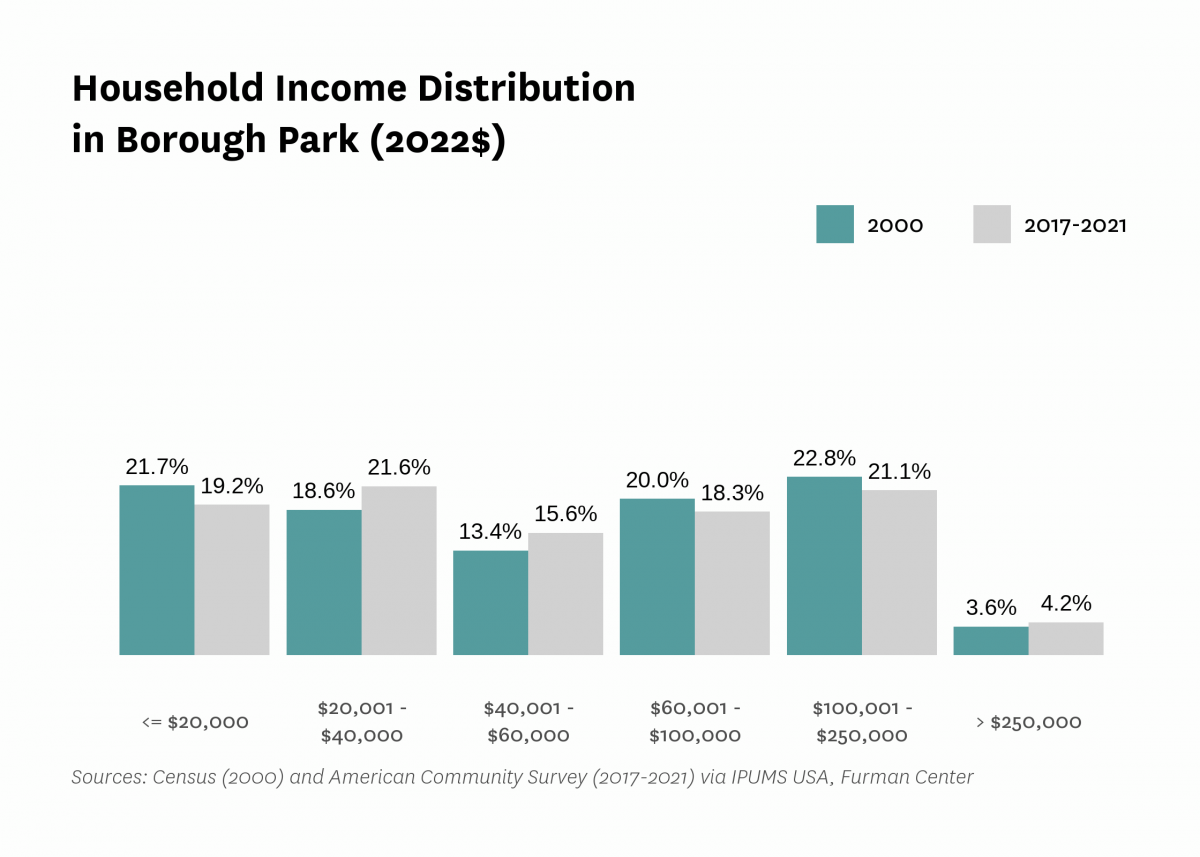
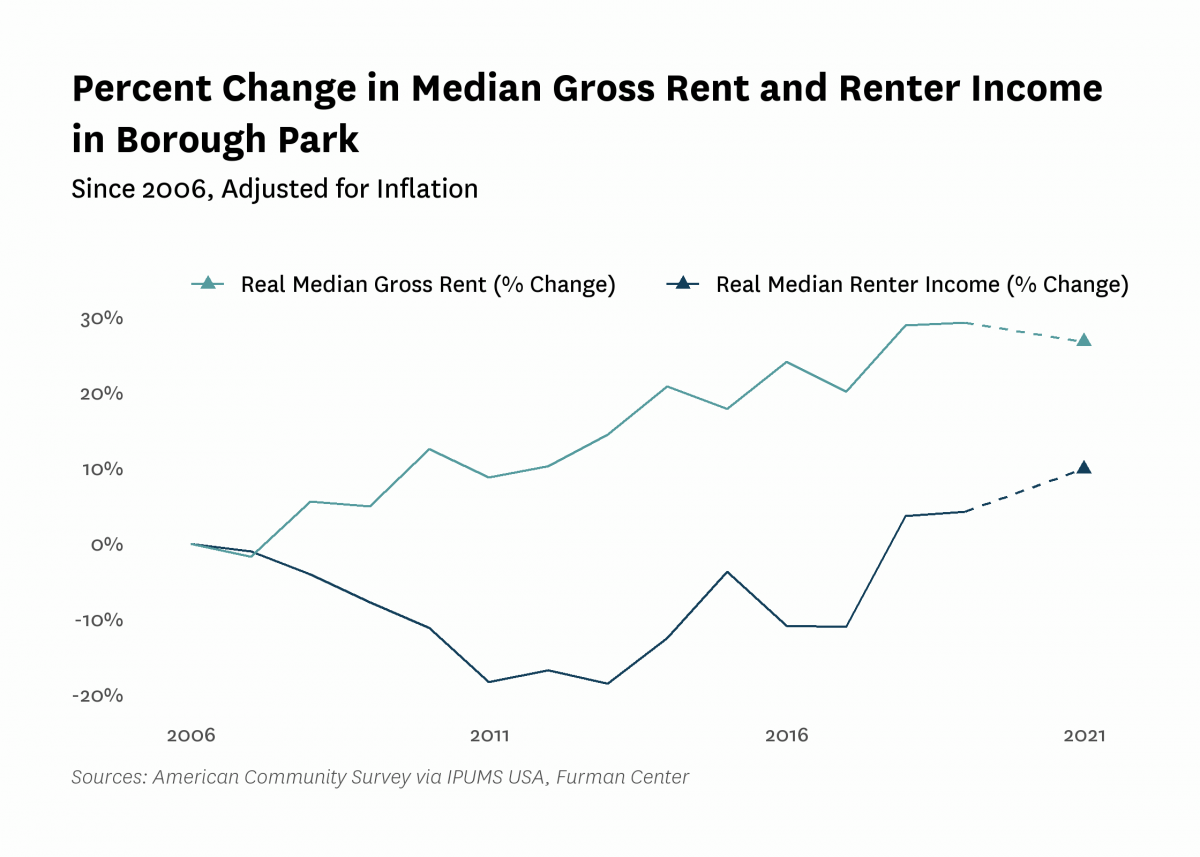
| Median household income (2022$) | $55,550 | $56,270 | $46,530 | $61,400 | $61,280 | |
| Median household income, homeowners (2022$) | $88,550 | $69,860 | $91,980 | $89,220 | ||
| Median household income, renters (2022$) | $43,950 | $39,080 | $45,830 | $48,310 | ||
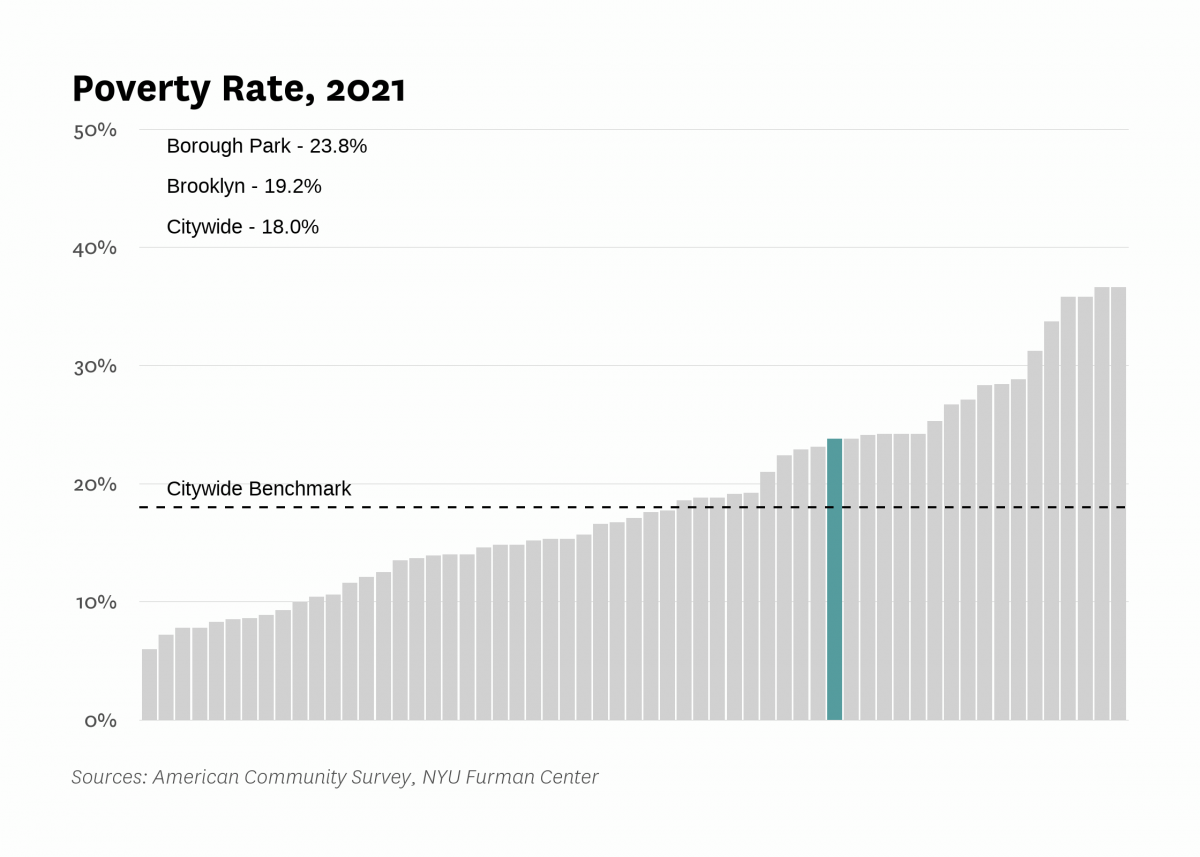
| Poverty rate | 28.5% | 24.5% | 32.2% | 26.8% | 23.8% | |
| Poverty rate, population aged 65+ | 18.7% | 15.4% | 15.1% | 12.2% | ||
| Poverty rate, population under 18 years old | 32.8% | 44.7% | 37.1% | 31.8% | ||
| Labor Market | ||||||
| Labor force participation rate | 56.2% | 54.1% | 58.4% | 61.2% | ||
| Population aged 25+ without a high school diploma | 24.1% | 27.3% | 21.2% | 18.5% | ||
| Unemployment rate | 7.44% | 6.13% | 8.05% | 3.99% | 13.22% | |
| Indicator | 2000 | 2006 | 2010 | 2019 | 2021 | 2022 |
|---|---|---|---|---|---|---|
| Housing Stock | ||||||
| Homeownership rate | 29.3% | 31.1% | 30.6% | 33.7% | 32.6% | |
| Housing units | 49,181 | 50,573 | 48,050 | 54,686 | ||
| Rental vacancy rate | 3.0% | 3.4% | 2.9% | |||
| Serious housing code violations (per 1,000 privately owned rental units) | 33.3 | 41.9 | 69.4 | 59.9 | 65.6 | |
| Severe crowding rate (% of renter households) | 7.5% | 10.2% | 9.5% | |||
| Total housing code violations (per 1,000 privately owned rental units) | 179.0 | 196.8 | 263.7 | 326.1 | 318.7 | |
| Finance - Distress | ||||||
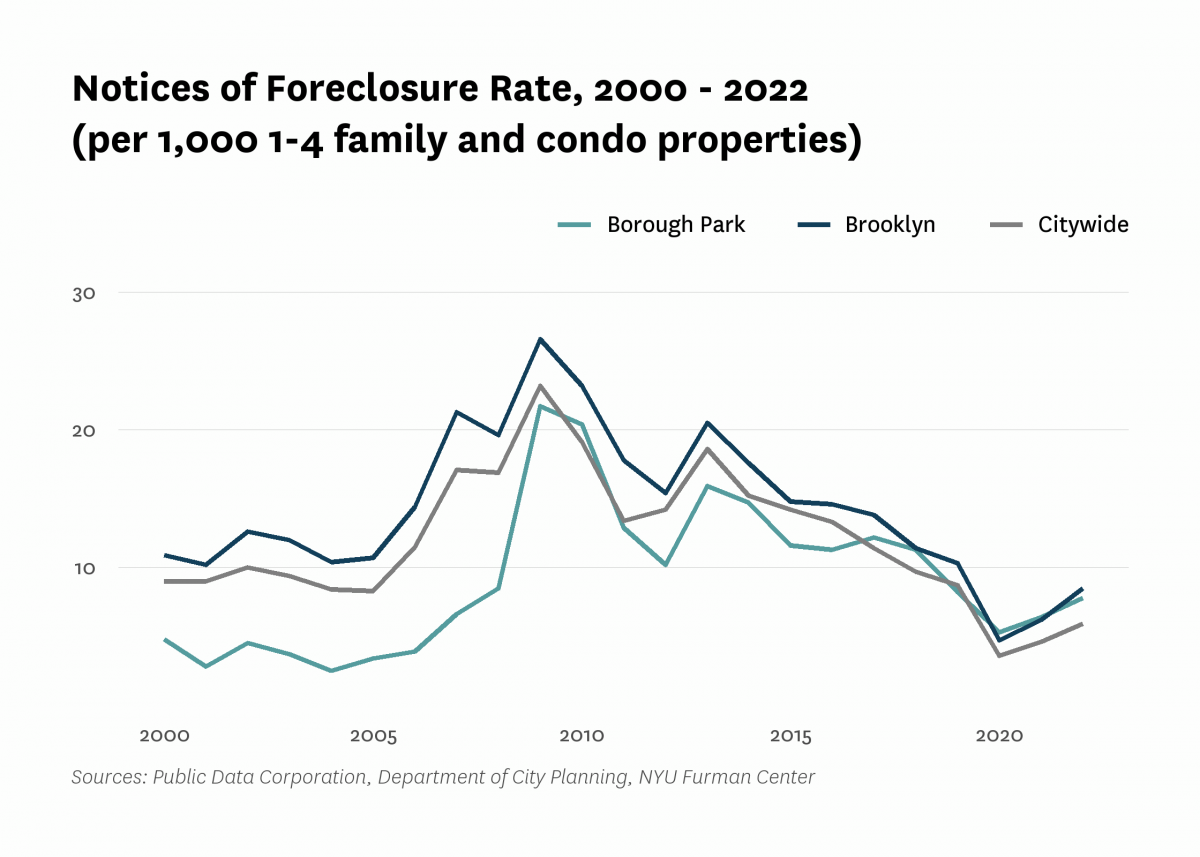
| Notices of foreclosure rate (per 1,000 1-4 family and condo properties) | 4.8 | 3.9 | 20.4 | 8.2 | 6.4 | 7.8 |
| Notices of foreclosure, all residential properties | 83 | 70 | 365 | 152 | 120 | 154 |
| Notices of foreclosure, initial, 1-4 family and condo properties | 48 | 47 | 270 | 60 | 30 | 63 |
| Notices of foreclosure, repeat, 1-4 family and condo properties | 27 | 17 | 74 | 84 | 83 | 78 |
| Pre-foreclosure notice rate (per 1,000 1-4 family and condo properties) | 27.6 | 13.8 | 29.9 | |||
| Pre-foreclosure notices, 1-4 family and condo properties | 482 | 249 | 539 | |||
| Properties entering REO, 1-4 family | 6 | 0 | 0 | |||
| Finance - Lending | ||||||
| FHA/VA-backed home purchase loans (% of home purchase loans) | 0.0% | 6.9% | 0.0% | 0.7% | ||
| Higher-cost home purchase loans (% of home purchase loans) | 7.6% | 0.8% | 1.9% | 3.2% | ||
| Higher-cost refinance loans (% of refinance loans) | 19.8% | 1.7% | 2.4% | 0.9% | ||
| Home purchase loan rate (per 1,000 properties) | 24.6 | 12.6 | 15.7 | 33.6 | ||
| Home purchase loans in LMI tracts (% of home purchase loans) | 66.9% | 12.6% | 65.4% | 70.9% | ||
| Home purchase loans to LMI borrowers (% of home purchase loans) | 5.3% | 59.3% | 5.2% | 7.6% | ||
| Refinance loan rate (per 1,000 properties) | 26.0 | 12.2 | 20.5 | 54.9 | ||
| Sales - Volume | ||||||
| Sales volume, 1 family building | 122 | 105 | 58 | 71 | 68 | 94 |
| Sales volume, 2-4 family building | 362 | 404 | 178 | 155 | 180 | 289 |
| Sales volume, 5+ family building | 20 | 18 | 20 | 12 | 11 | 20 |
| Sales volume, condominium | 62 | 144 | 142 | 130 | 327 | 186 |
| Sales volume, all property types | 566 | 671 | 398 | 368 | 586 | 589 |
| Sales - Median Prices | ||||||
| Median sales price per unit, 1 family building (2022$) | $526,810 | $948,550 | $740,380 | $1,337,950 | $1,379,860 | $1,388,130 |
| Median sales price per unit, 2-4 family building (2022$) | $263,410 | $483,060 | $418,480 | $650,390 | $697,620 | $725,000 |
| Median sales price per unit, 5+ family building (2022$) | $93,470 | $173,460 | $138,350 | $233,440 | $306,640 | $212,920 |
| Median sales price per unit, condominium (2022$) | $327,140 | $619,850 | $575,790 | $851,480 | $928,400 | $934,500 |
| Sales - Housing Price Index | ||||||
| Index of housing price appreciation, 1 family building | 100.0 | 200.8 | 170.4 | 348.3 | 394.4 | 392.6 |
| Index of housing price appreciation, 2-4 family building | 100.0 | 220.4 | 179.7 | 376.2 | 381.5 | 397.4 |
| Index of housing price appreciation, 5+ family building | 100.0 | 198.5 | 274.3 | 683.6 | 524.4 | 429.5 |
| Index of housing price appreciation, condominium | 100.0 | 177.7 | 180.2 | 304.6 | 311.8 | 394.2 |
| Index of housing price appreciation, all property types | 100.0 | 211.8 | 183.6 | 353.4 | 360.7 | 401.2 |
| Subsidized Housing | ||||||
| Total number of subsidized properties (properties) | 49 | |||||
| HUD Financing or Insurance (properties) | 2 | |||||
| HUD Financing or Insurance (units) | 0 | |||||
| HUD Project-based Rental Assistance Program (properties) | 15 | |||||
| HUD Project-based Rental Assistance Program (units) | 695 | |||||
| Low Income Housing Tax Credit (properties) | 5 | |||||
| Low Income Housing Tax Credit (units) | 359 | |||||
| Public Housing (properties) | 0 | |||||
| Public Housing (units) | 0 | |||||
| Mitchell-Lama (properties) | 1 | |||||
| Mitchell-Lama (units) | 183 | |||||
| 421-a Tax Exemption (properties) | 138 | |||||
| 421-a Tax Exemption (units) | 2,963 | |||||
| 420-c Tax Exemption (properties) | 7 | |||||
| 420-c Tax Exemption (units) | 460 | |||||
| NYC Housing Production Programs and Zoning Incentives or Requirements (properties) | 19 | |||||
| Eligible to expire from housing programs between 2023 and 2028 (properties) | 11 | |||||
| Eligible to expire from housing programs between 2023 and 2028 (units) | 308 | |||||
| Eligible to expire from housing programs between 2029 and 2038 (properties) | 7 | |||||
| Eligible to expire from housing programs between 2029 and 2038 (units) | 399 | |||||
| Eligible to expire from housing programs in 2039 and later (properties) | 1 | |||||
| Eligible to expire from housing programs in 2039 and later (units) | 0 | |||||
| Indicator | 2000 | 2006 | 2010 | 2019 | 2021 | 2022 |
|---|---|---|---|---|---|---|
| Density | ||||||
| Population density (1,000 persons per square mile) | 49.4 | 53.7 | 48.8 | 54.8 | ||
| Development | ||||||
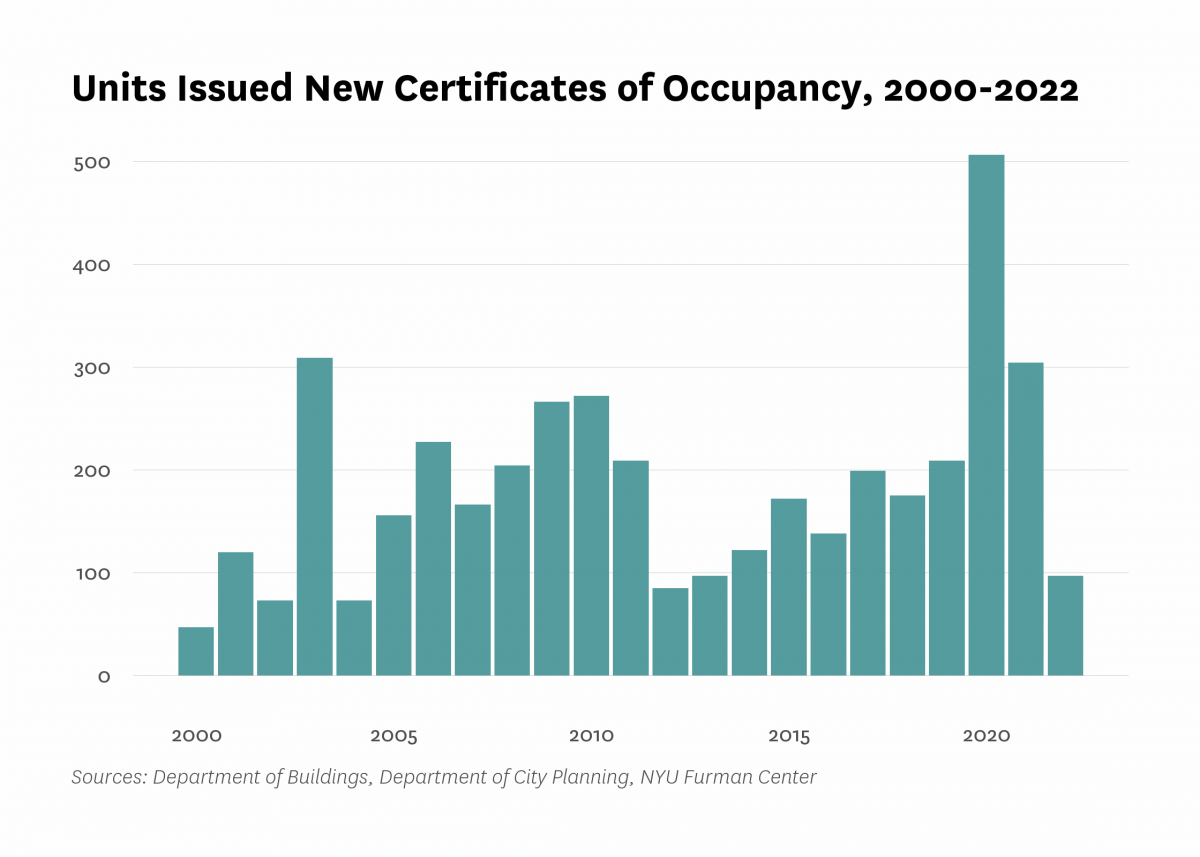
| Units authorized by new residential building permits | 122 | 0 | 52 | 140 | 89 | 265 |
| Units issued new certificates of occupancy | 47 | 227 | 272 | 209 | 304 | 97 |
| Indicator | 2000 | 2006 | 2010 | 2019 | 2021 | 2022 |
|---|---|---|---|---|---|---|
| Commute | ||||||
| Car-free commute (% of commuters) | 63.1% | 65.6% | 71.3% | 67.3% | 57.5% | |
| Mean travel time to work (minutes) | 37.3 | 34.6 | 36.0 | 36.9 | 34.9 | |
| Crime and Incarceration | ||||||
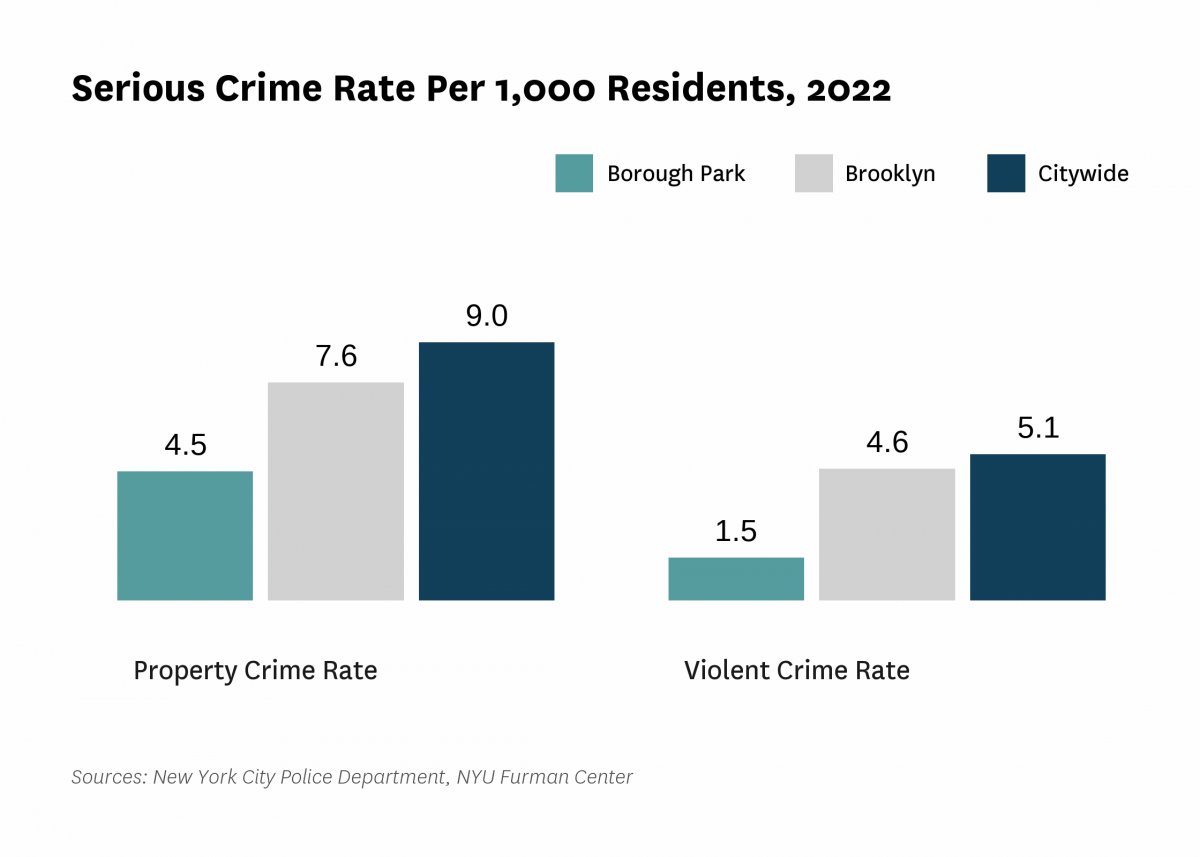
| Serious crime rate (per 1,000 residents) | 7.5 | 6.6 | 4.8 | 4.7 | 6.1 | |
| Serious crime rate, property (per 1,000 residents) | 5.7 | 4.8 | 3.5 | 3.6 | 4.5 | |
| Serious crime rate, violent (per 1,000 residents) | 1.9 | 1.8 | 1.3 | 1.1 | 1.5 | |
| Schools | ||||||
| Students performing at grade level in English language arts, 4th grade | 56.4% | 55.7% | ||||
| Students performing at grade level in math, 4th grade | 62.6% | 54.5% | ||||
| Indicator | 2000 | 2006 | 2010 | 2019 | 2021 | 2022 |
|---|---|---|---|---|---|---|
| Median Rent | ||||||
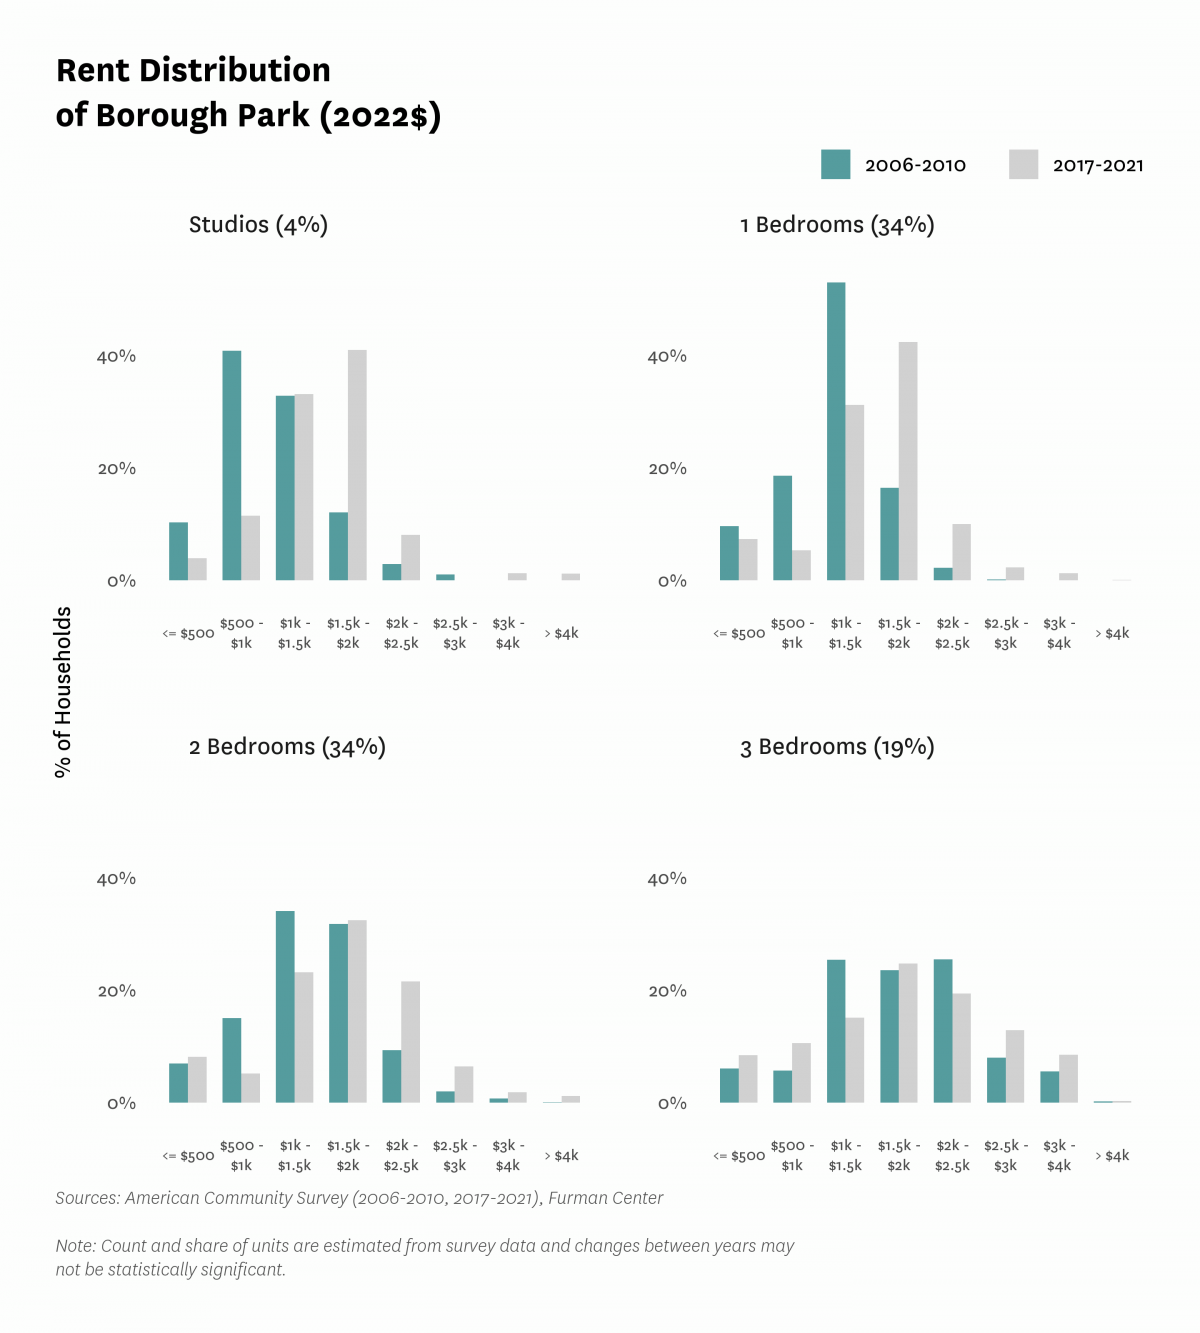
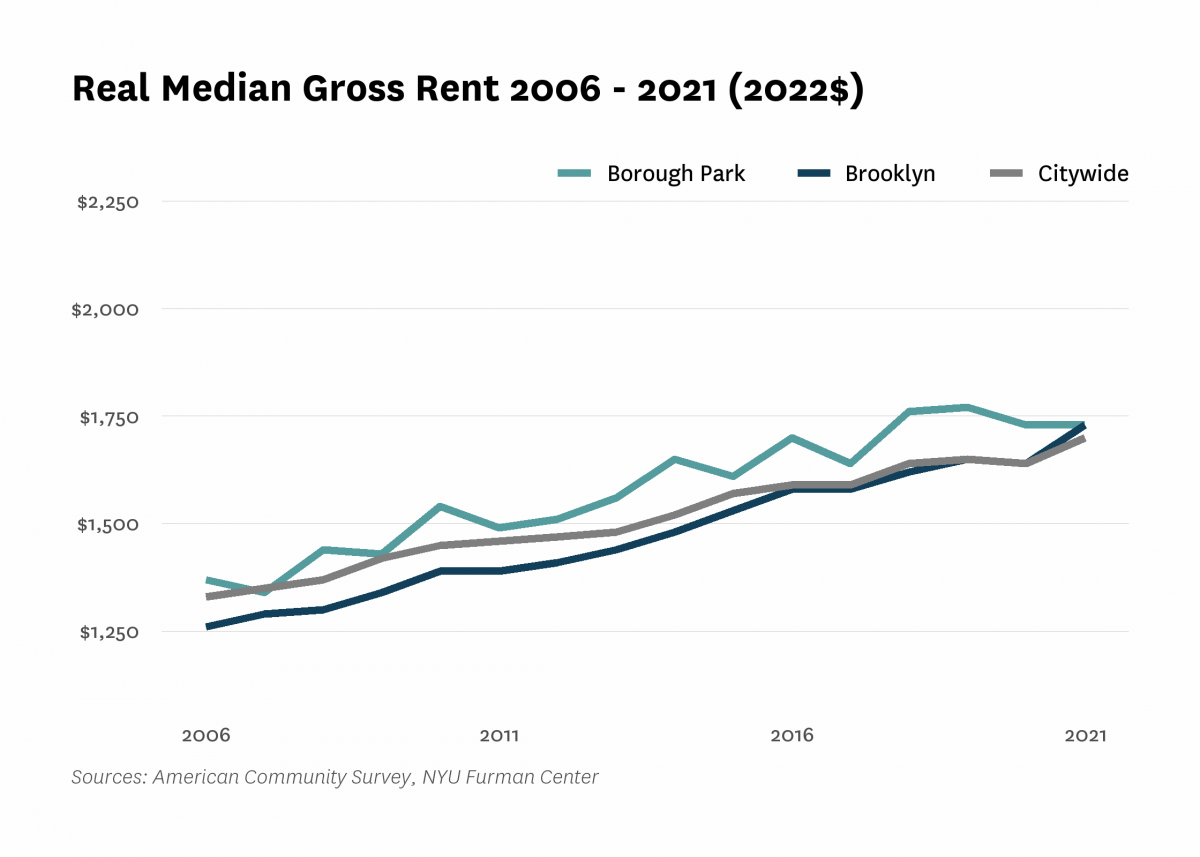
| Median rent, 2- and 3-bedrooms (2022$) | $1,540 | $1,760 | $1,790 | |||
| Median rent, all (2022$) | $1,240 | $1,370 | $1,540 | $1,770 | $1,730 | |
| Median rent, recent movers (2022$) | $1,530 | $1,960 | $1,990 | |||
| Median rent, studios and 1-bedrooms (2022$) | $1,210 | $1,460 | $1,550 | |||
| Change in collected rent (2019-2020) | 1.2% | |||||
| Affordability | ||||||
| Rental units affordable at 30% AMI (% of recently available units) | 1.8% | 4.0% | 4.8% | |||
| Rental units affordable at 80% AMI (% of recently available units) | 67.9% | 61.5% | 69.2% | |||
| Rental units affordable at 120% AMI (% of recently available units) | 97.2% | 94.1% | 97.6% | |||
| Rent Burden | ||||||
| Moderately rent-burdened households | 22.3% | 24.1% | 24.6% | 20.6% | ||
| Moderately rent-burdened households, low income | 28.1% | 28.1% | 28.5% | |||
| Moderately rent-burdened households, moderate income | 15.8% | 13.1% | 8.3% | |||
| Severely rent-burdened households | 35.0% | 39.1% | 43.5% | 39.8% | ||
| Severely rent-burdened households, low income | 51.5% | 56.5% | 52.4% | |||
| Severely rent-burdened households, moderate income | 0.0% | 0.0% | 0.0% | |||
| Rental Subsidy | ||||||
| Housing choice vouchers (% of occupied, privately owned rental units) | 12.1% | 11.6% | ||||
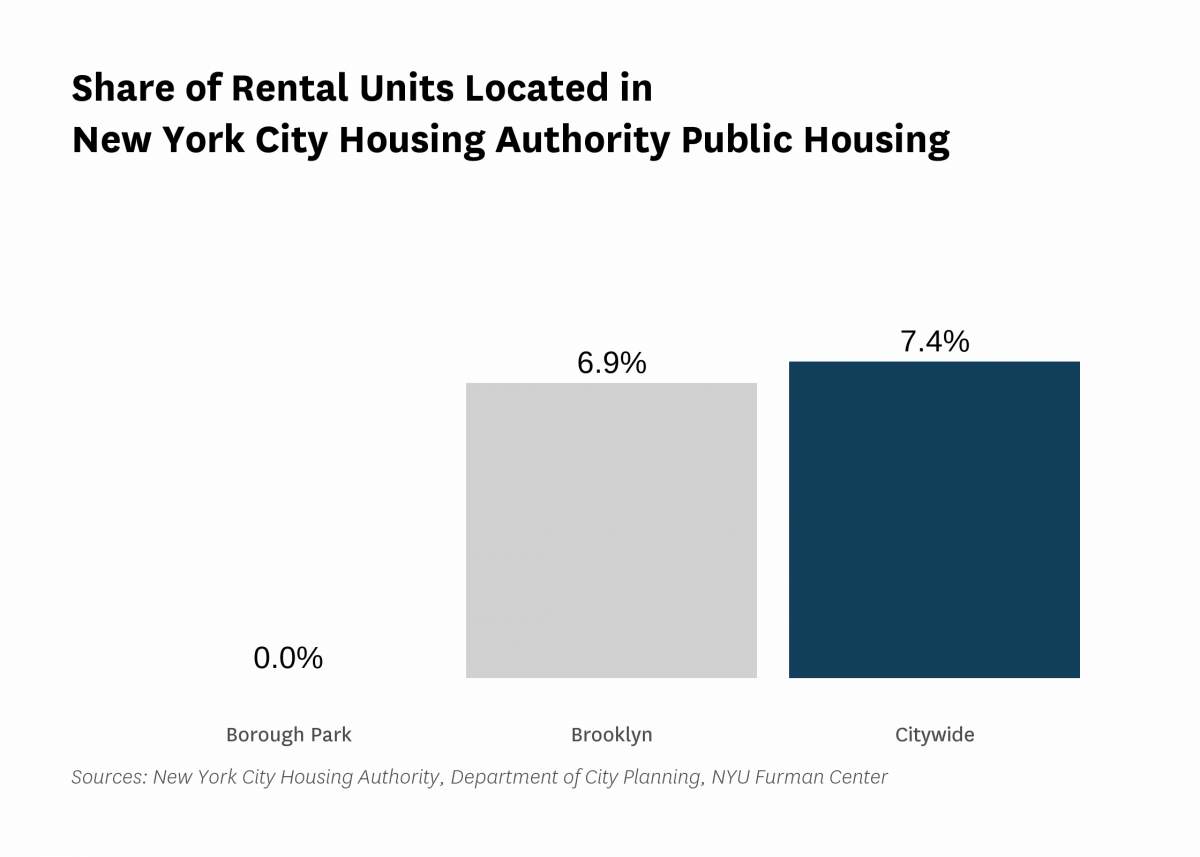
| Public housing (% of rental units) | 0.0% | |||||
Data Notes: See Indicator Definitions, Rankings, and Methods for more information.
Indicators: The rental vacancy rate, severe crowding rate, and the severely rent-burdened households indicators use five-year American Community Survey (ACS) estimates. Data under the 2010 heading comes from the 2006 – 2010 ACS, data under the 2019 heading comes from the 2015 – 2019 ACS and data under the 2021 heading comes from 2017 – 2021 ACS .
All content © 2005 – 2024 Furman Center for Real Estate and Urban Policy | Top of page | Contact Us