| Indicator | 2000 | 2006 | 2010 | 2019 | 2021 | 2022 |
|---|---|---|---|---|---|---|
| Population | ||||||
| Born in New York State | 44.7% | 43.8% | 38.9% | 39.9% | ||
| Disabled population | 6.1% | 5.8% | 5.8% | |||
| Foreign-born population | 50.7% | 51.1% | 52.2% | 56.5% | 55.1% | |
| Population | 171,778 | 174,593 | 164,506 | 186,959 | 206,519 | |
| Population aged 65+ | 17.0% | 18.0% | 20.5% | 16.5% | 16.1% | |
| Households | ||||||
| Households with children under 18 years old | 31.9% | 31.9% | 29.4% | 34.5% | 33.9% | |
| Single-person households | 28.0% | 27.1% | 20.9% | 20.8% | ||
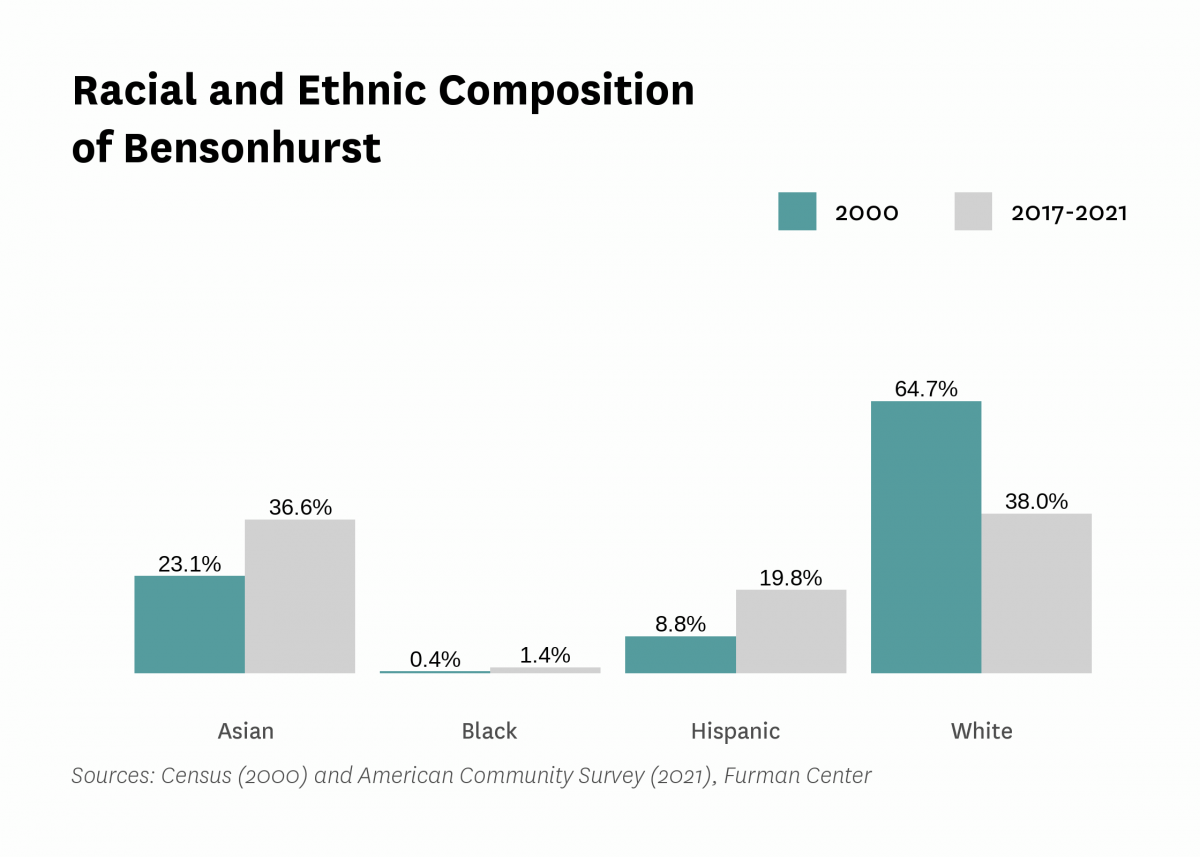
| Race and Ethnicity | ||||||
| Percent Asian | 23.1% | 30.2% | 33.7% | 41.0% | 36.6% | |
| Percent Black | 0.4% | 0.3% | 0.1% | 1.1% | 1.4% | |
| Percent Hispanic | 8.8% | 9.9% | 13.4% | 16.0% | 19.8% | |
| Percent white | 64.7% | 58.6% | 50.7% | 38.4% | 38.0% | |
| Racial diversity index | 0.52 | 0.55 | 0.61 | 0.66 | 0.68 | |
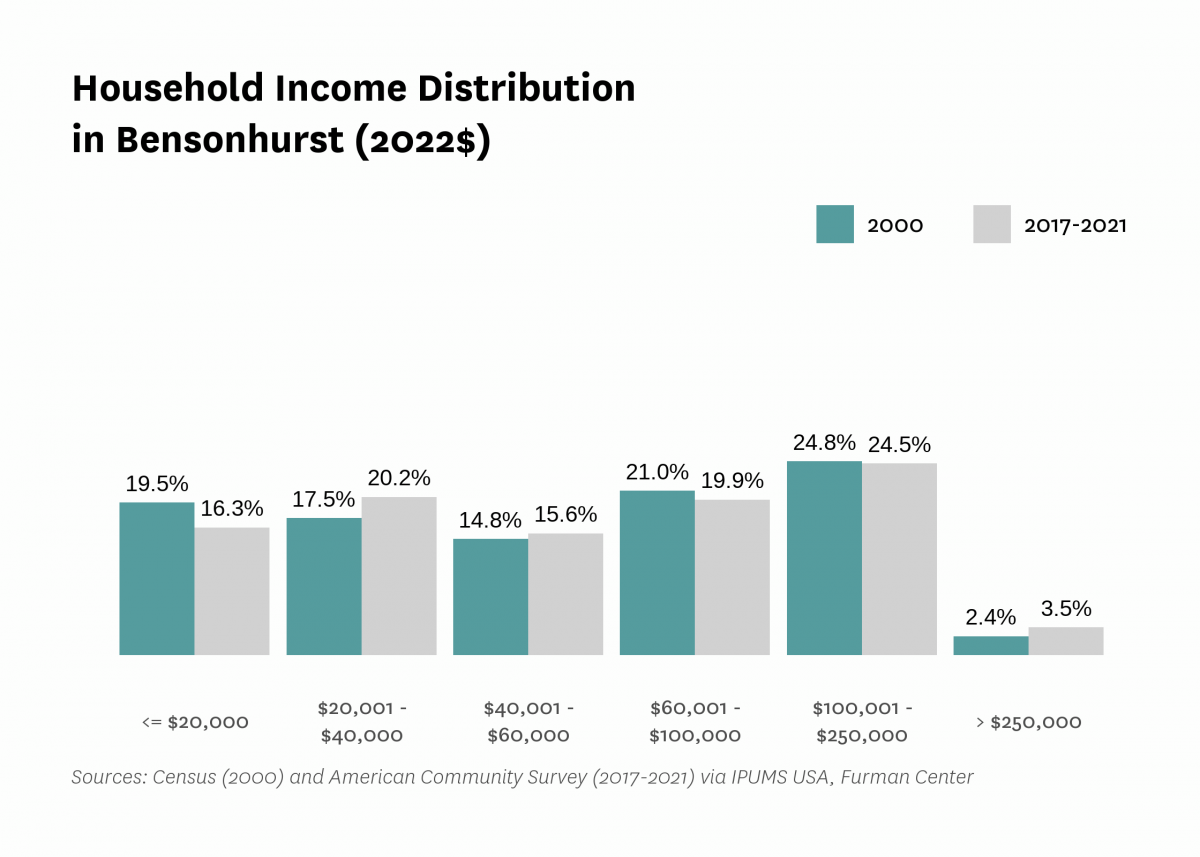
| Income and Poverty | ||||||
| Income diversity ratio | 5.8 | 4.7 | 5.3 | 5.8 | ||
| Median household income (2022$) | $59,580 | $54,400 | $49,240 | $63,710 | $59,390 | |
| Median household income, homeowners (2022$) | $81,530 | $67,280 | $92,430 | $81,240 | ||
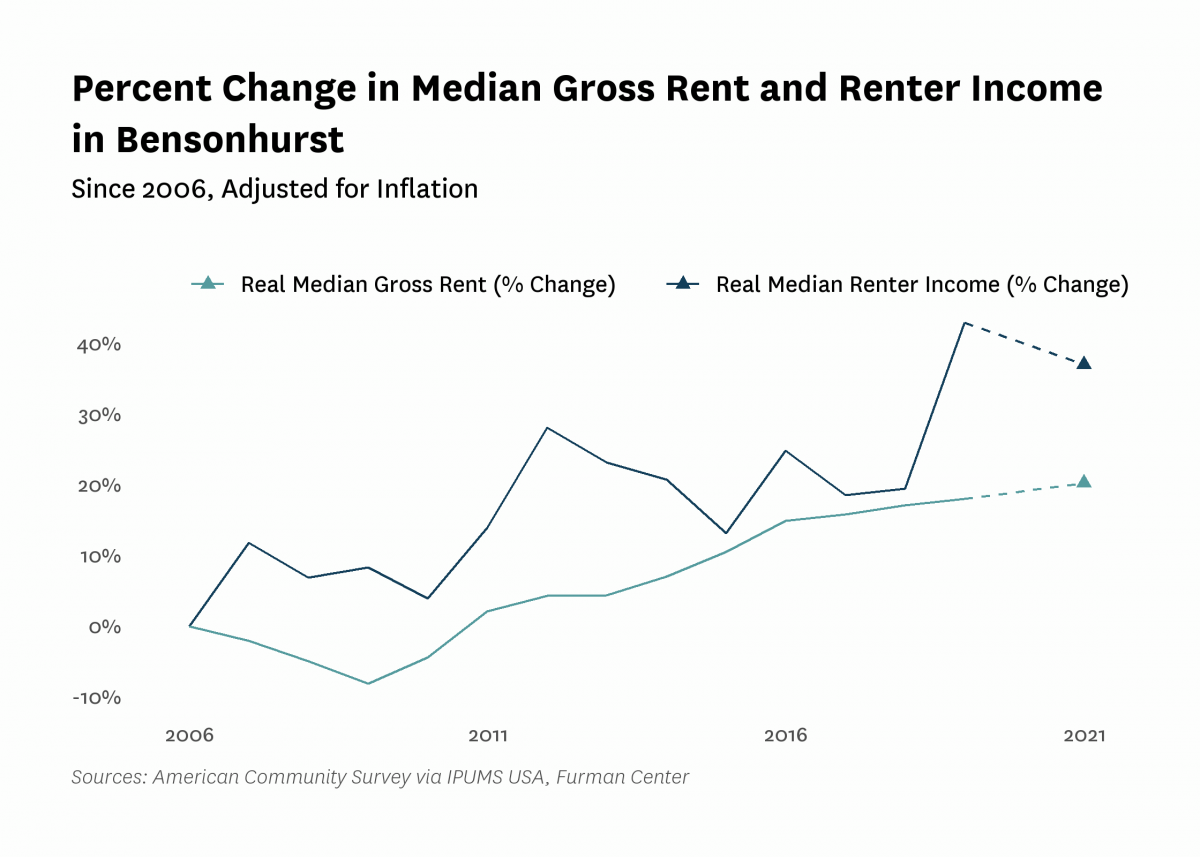
| Median household income, renters (2022$) | $39,590 | $41,120 | $56,580 | $54,220 | ||
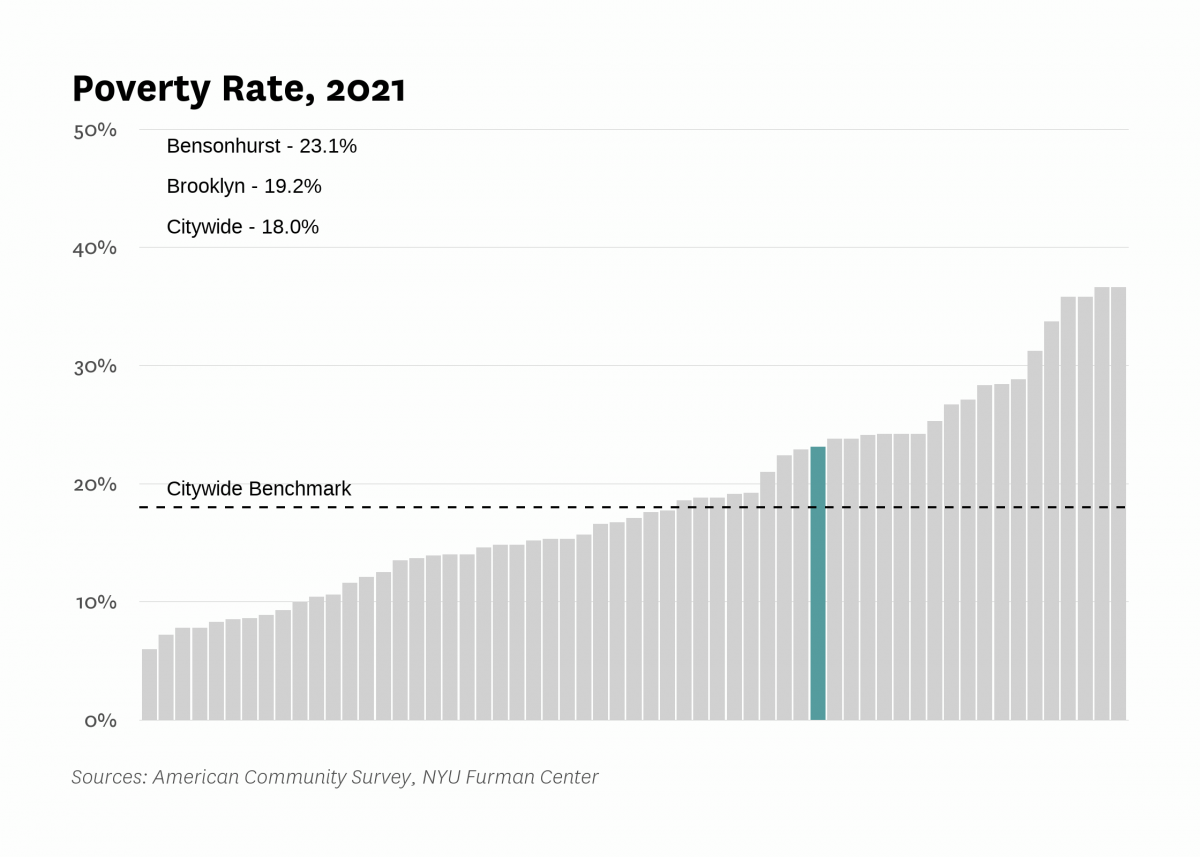
| Poverty rate | 19.7% | 17.9% | 14.0% | 14.6% | 23.1% | |
| Poverty rate, population aged 65+ | 22.6% | 12.4% | 21.2% | 21.4% | ||
| Poverty rate, population under 18 years old | 24.4% | 20.1% | 17.3% | 32.6% | ||
| Labor Market | ||||||
| Labor force participation rate | 57.1% | 53.9% | 63.3% | 58.0% | ||
| Population aged 25+ without a high school diploma | 28.3% | 30.1% | 25.0% | 25.4% | ||
| Unemployment rate | 7.12% | 4.88% | 8.60% | 4.53% | 11.74% | |
| Indicator | 2000 | 2006 | 2010 | 2019 | 2021 | 2022 |
|---|---|---|---|---|---|---|
| Housing Stock | ||||||
| Homeownership rate | 31.2% | 39.1% | 39.4% | 36.5% | 32.6% | |
| Housing units | 66,327 | 67,271 | 68,574 | 76,452 | ||
| Rental vacancy rate | 3.9% | 2.0% | 2.2% | |||
| Serious housing code violations (per 1,000 privately owned rental units) | 17.2 | 22.5 | 55.0 | 53.5 | 55.5 | |
| Severe crowding rate (% of renter households) | 3.9% | 6.0% | 6.5% | |||
| Total housing code violations (per 1,000 privately owned rental units) | 116.5 | 118.9 | 222.0 | 285.1 | 278.7 | |
| Finance - Distress | ||||||
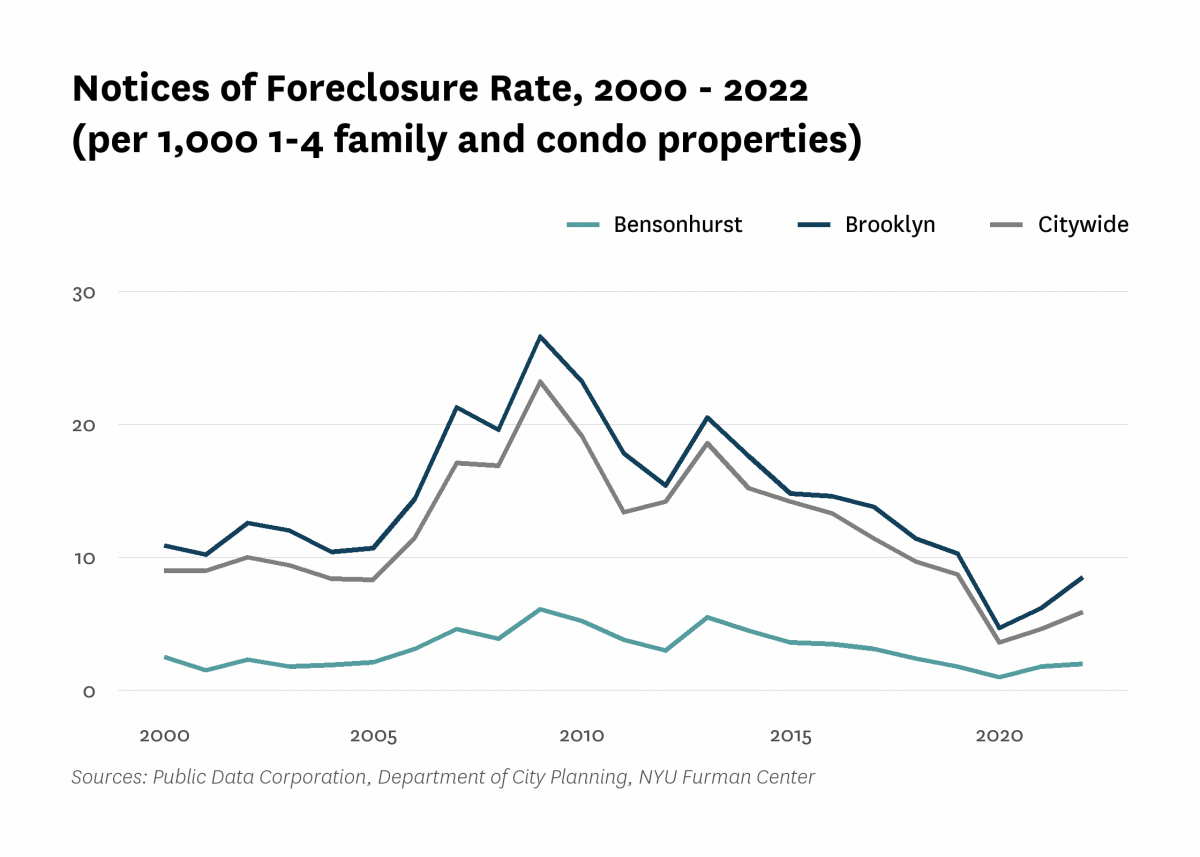
| Notices of foreclosure rate (per 1,000 1-4 family and condo properties) | 2.5 | 3.1 | 5.2 | 1.8 | 1.8 | 2.0 |
| Notices of foreclosure, all residential properties | 53 | 60 | 110 | 42 | 39 | 47 |
| Notices of foreclosure, initial, 1-4 family and condo properties | 36 | 46 | 80 | 20 | 13 | 22 |
| Notices of foreclosure, repeat, 1-4 family and condo properties | 9 | 12 | 22 | 17 | 24 | 19 |
| Pre-foreclosure notice rate (per 1,000 1-4 family and condo properties) | 18.0 | 9.4 | 18.7 | |||
| Pre-foreclosure notices, 1-4 family and condo properties | 364 | 192 | 381 | |||
| Properties entering REO, 1-4 family | 1 | 1 | 2 | |||
| Finance - Lending | ||||||
| FHA/VA-backed home purchase loans (% of home purchase loans) | 0.0% | 1.4% | 0.3% | 0.2% | ||
| Higher-cost home purchase loans (% of home purchase loans) | 8.4% | 0.5% | 4.9% | 5.9% | ||
| Higher-cost refinance loans (% of refinance loans) | 20.4% | 2.6% | 2.7% | 1.8% | ||
| Home purchase loan rate (per 1,000 properties) | 34.8 | 25.8 | 17.0 | 25.2 | ||
| Home purchase loans in LMI tracts (% of home purchase loans) | 40.6% | 11.0% | 42.5% | 45.6% | ||
| Home purchase loans to LMI borrowers (% of home purchase loans) | 3.5% | 36.7% | 11.1% | 11.8% | ||
| Refinance loan rate (per 1,000 properties) | 25.3 | 13.6 | 13.0 | 31.9 | ||
| Sales - Volume | ||||||
| Sales volume, 1 family building | 125 | 128 | 77 | 87 | 53 | 103 |
| Sales volume, 2-4 family building | 446 | 532 | 300 | 235 | 242 | 416 |
| Sales volume, 5+ family building | 20 | 31 | 17 | 21 | 20 | 26 |
| Sales volume, condominium | 33 | 113 | 125 | 68 | 94 | 61 |
| Sales volume, all property types | 624 | 804 | 519 | 411 | 409 | 606 |
| Sales - Median Prices | ||||||
| Median sales price per unit, 1 family building (2022$) | $446,940 | $724,410 | $727,500 | $958,860 | $992,060 | $950,000 |
| Median sales price per unit, 2-4 family building (2022$) | $246,410 | $404,010 | $400,880 | $556,360 | $525,210 | $545,000 |
| Median sales price per unit, 5+ family building (2022$) | $82,320 | $156,830 | $160,950 | $263,870 | $222,820 | $227,600 |
| Median sales price per unit, condominium (2022$) | $439,410 | $639,800 | $532,700 | $641,100 | $657,840 | $620,000 |
| Sales - Housing Price Index | ||||||
| Index of housing price appreciation, 1 family building | 100.0 | 193.2 | 217.0 | 328.9 | 371.1 | 362.0 |
| Index of housing price appreciation, 2-4 family building | 100.0 | 193.6 | 219.6 | 343.4 | 386.8 | 372.4 |
| Index of housing price appreciation, 5+ family building | 100.0 | 212.3 | 254.7 | 363.4 | 373.9 | 424.7 |
| Index of housing price appreciation, condominium | 100.0 | 200.2 | 200.6 | 308.9 | 297.0 | 301.9 |
| Index of housing price appreciation, all property types | 100.0 | 197.6 | 220.9 | 342.1 | 366.0 | 365.0 |
| Subsidized Housing | ||||||
| Total number of subsidized properties (properties) | 11 | |||||
| HUD Financing or Insurance (properties) | 2 | |||||
| HUD Financing or Insurance (units) | 0 | |||||
| HUD Project-based Rental Assistance Program (properties) | 1 | |||||
| HUD Project-based Rental Assistance Program (units) | 52 | |||||
| Low Income Housing Tax Credit (properties) | 2 | |||||
| Low Income Housing Tax Credit (units) | 218 | |||||
| Public Housing (properties) | 0 | |||||
| Public Housing (units) | 0 | |||||
| Mitchell-Lama (properties) | 1 | |||||
| Mitchell-Lama (units) | 125 | |||||
| 421-a Tax Exemption (properties) | 122 | |||||
| 421-a Tax Exemption (units) | 1,517 | |||||
| 420-c Tax Exemption (properties) | 0 | |||||
| 420-c Tax Exemption (units) | 0 | |||||
| NYC Housing Production Programs and Zoning Incentives or Requirements (properties) | 4 | |||||
| Eligible to expire from housing programs between 2023 and 2028 (properties) | 0 | |||||
| Eligible to expire from housing programs between 2023 and 2028 (units) | 0 | |||||
| Eligible to expire from housing programs between 2029 and 2038 (properties) | 1 | |||||
| Eligible to expire from housing programs between 2029 and 2038 (units) | 125 | |||||
| Eligible to expire from housing programs in 2039 and later (properties) | 4 | |||||
| Eligible to expire from housing programs in 2039 and later (units) | 218 | |||||
| Indicator | 2000 | 2006 | 2010 | 2019 | 2021 | 2022 |
|---|---|---|---|---|---|---|
| Density | ||||||
| Population density (1,000 persons per square mile) | 47.2 | 44.5 | 50.6 | 55.9 | ||
| Development | ||||||
| Units authorized by new residential building permits | 97 | 0 | 32 | 129 | 147 | 52 |
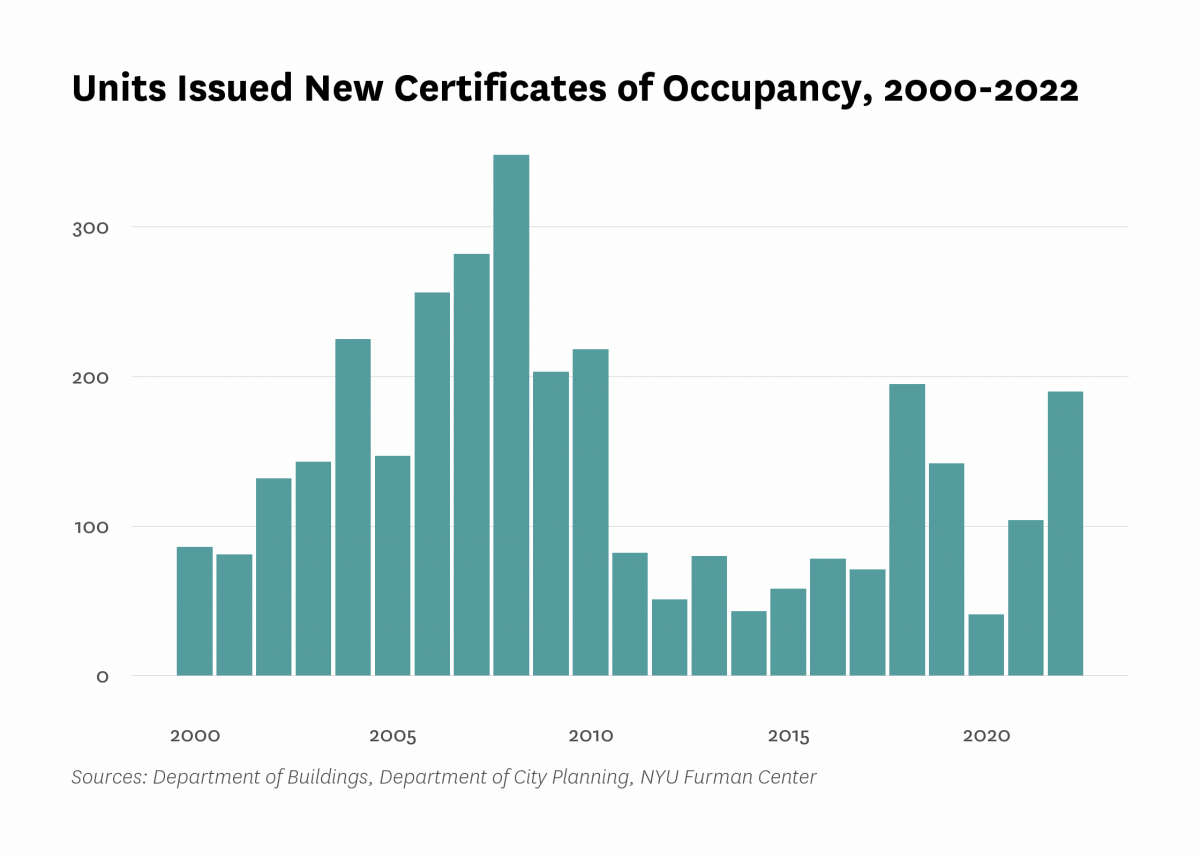
| Units issued new certificates of occupancy | 86 | 256 | 218 | 142 | 104 | 190 |
| Indicator | 2000 | 2006 | 2010 | 2019 | 2021 | 2022 |
|---|---|---|---|---|---|---|
| Commute | ||||||
| Car-free commute (% of commuters) | 63.3% | 66.6% | 69.6% | 67.8% | 64.7% | |
| Mean travel time to work (minutes) | 44.9 | 43.3 | 44.4 | 47.6 | 40.6 | |
| Crime and Incarceration | ||||||
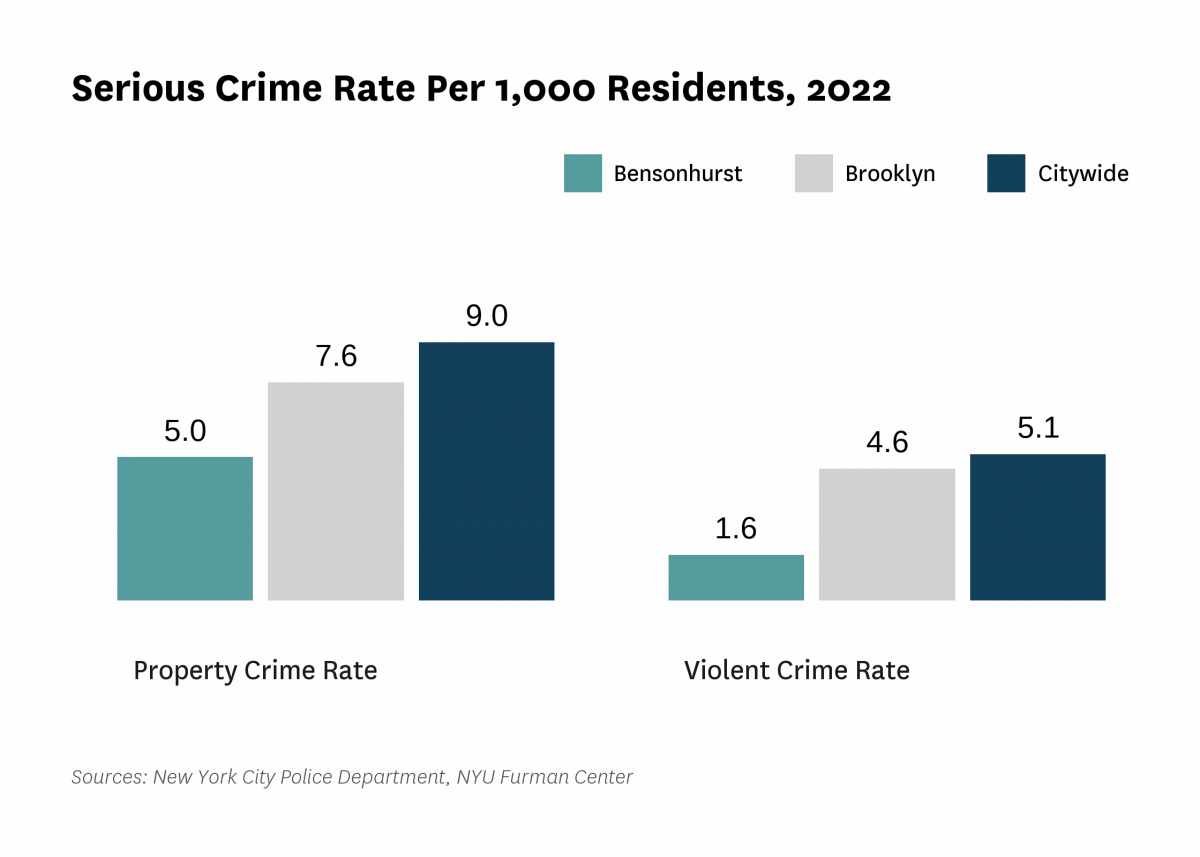
| Serious crime rate (per 1,000 residents) | 10.0 | 6.7 | 5.8 | 6.1 | 6.6 | |
| Serious crime rate, property (per 1,000 residents) | 7.8 | 5.0 | 4.4 | 4.6 | 5.0 | |
| Serious crime rate, violent (per 1,000 residents) | 2.3 | 1.7 | 1.4 | 1.5 | 1.6 | |
| Schools | ||||||
| Students performing at grade level in English language arts, 4th grade | 60.0% | 60.4% | ||||
| Students performing at grade level in math, 4th grade | 66.6% | 62.4% | ||||
| Indicator | 2000 | 2006 | 2010 | 2019 | 2021 | 2022 |
|---|---|---|---|---|---|---|
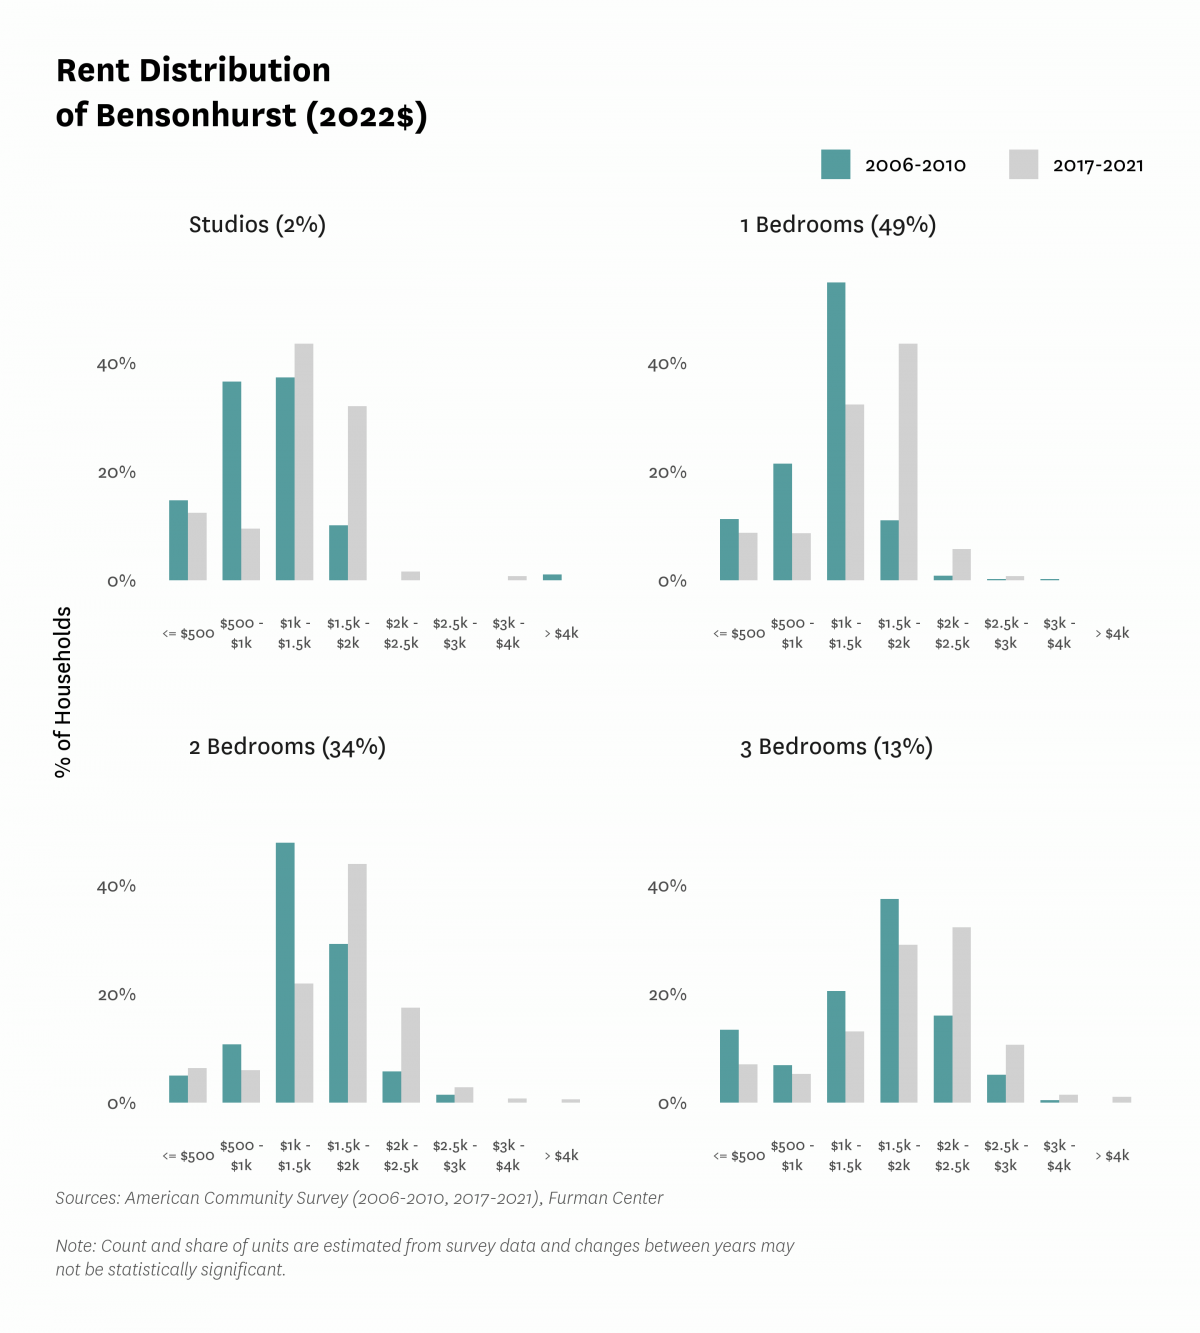
| Median Rent | ||||||
| Median rent, 2- and 3-bedrooms (2022$) | $1,460 | $1,650 | $1,770 | |||
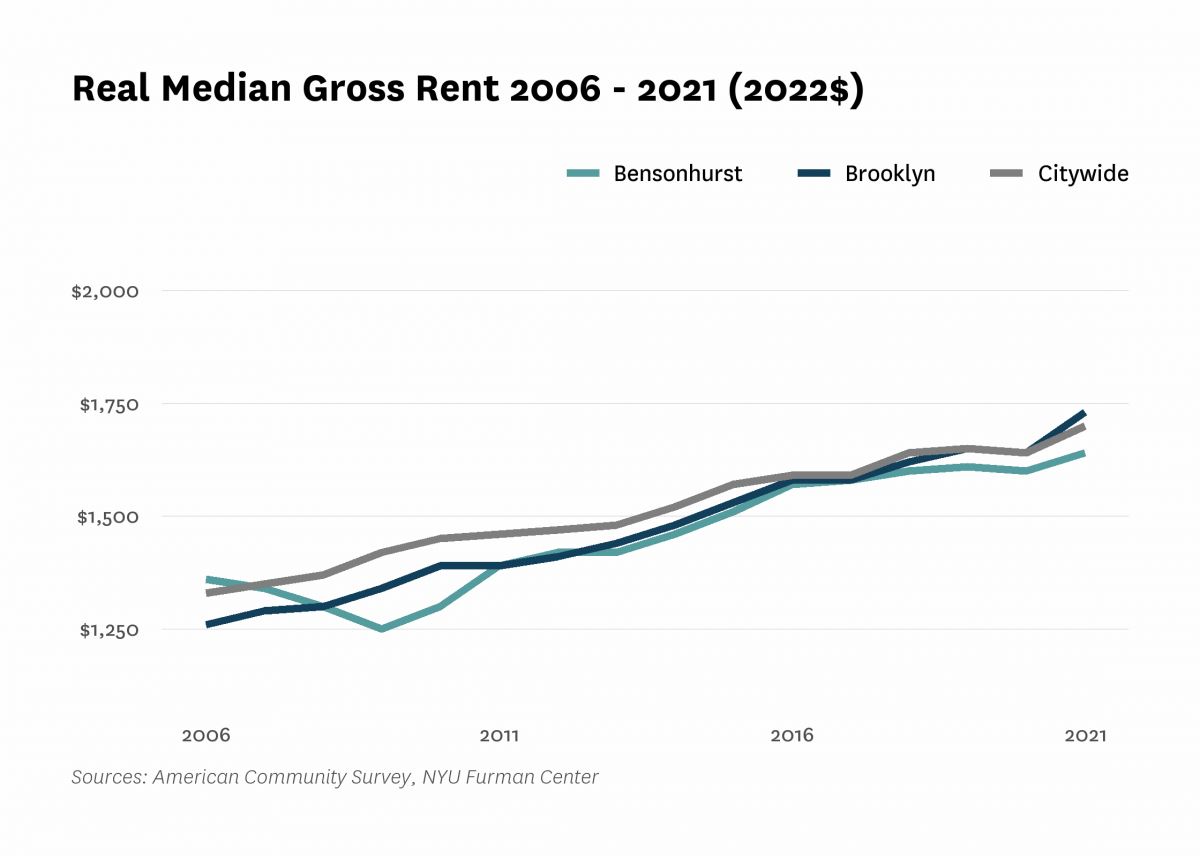
| Median rent, all (2022$) | $1,220 | $1,360 | $1,300 | $1,610 | $1,640 | |
| Median rent, recent movers (2022$) | $1,380 | $1,660 | $1,880 | |||
| Median rent, studios and 1-bedrooms (2022$) | $1,190 | $1,370 | $1,500 | |||
| Change in collected rent (2019-2020) | 0.9% | |||||
| Affordability | ||||||
| Rental units affordable at 30% AMI (% of recently available units) | 3.2% | 7.8% | 6.1% | |||
| Rental units affordable at 80% AMI (% of recently available units) | 82.5% | 84.1% | 82.0% | |||
| Rental units affordable at 120% AMI (% of recently available units) | 98.3% | 99.6% | 99.3% | |||
| Rent Burden | ||||||
| Moderately rent-burdened households | 23.3% | 31.1% | 25.1% | 23.1% | ||
| Moderately rent-burdened households, low income | 36.5% | 33.6% | 32.5% | |||
| Moderately rent-burdened households, moderate income | 6.7% | 3.5% | 2.7% | |||
| Severely rent-burdened households | 30.9% | 30.5% | 33.0% | 33.2% | ||
| Severely rent-burdened households, low income | 41.1% | 45.1% | 45.7% | |||
| Severely rent-burdened households, moderate income | 0.0% | 0.0% | 0.0% | |||
| Rental Subsidy | ||||||
| Housing choice vouchers (% of occupied, privately owned rental units) | 7.3% | 4.6% | ||||
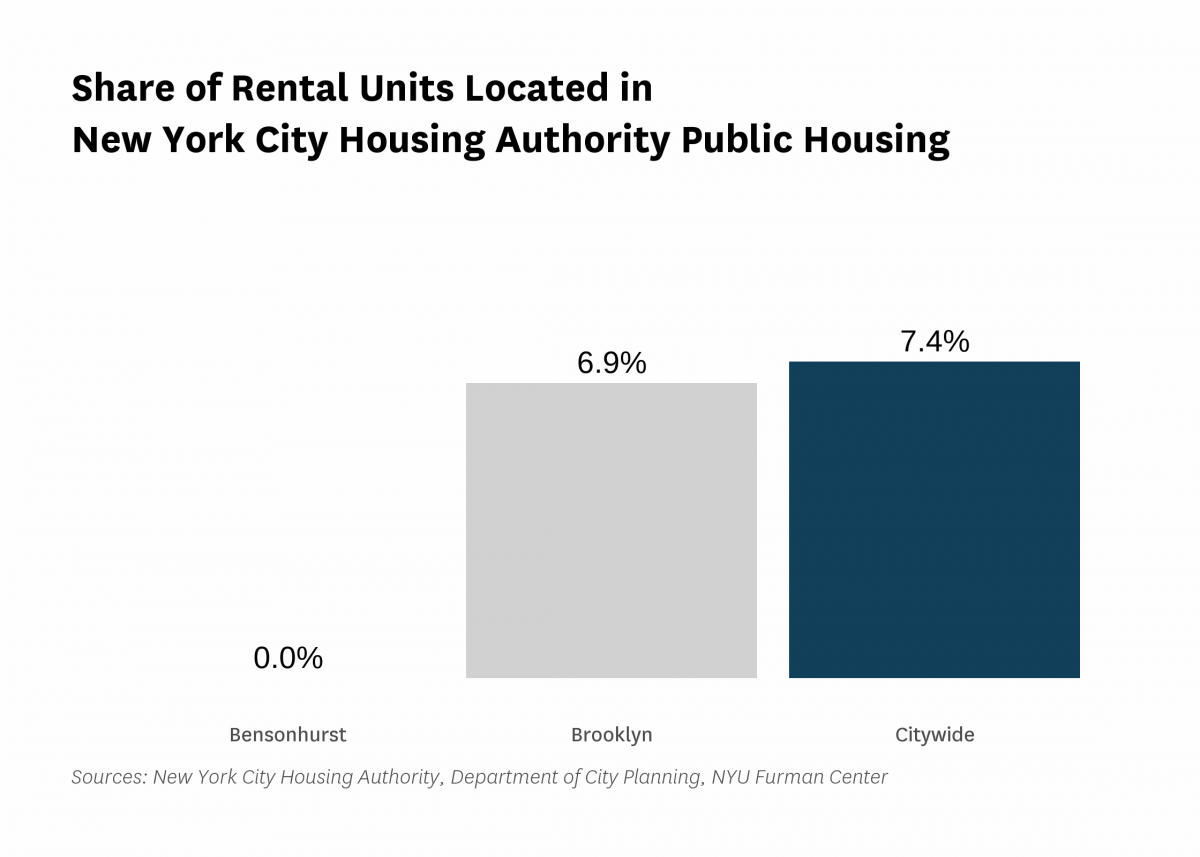
| Public housing (% of rental units) | 0.0% | |||||
Data Notes: See Indicator Definitions, Rankings, and Methods for more information.
Indicators: The rental vacancy rate, severe crowding rate, and the severely rent-burdened households indicators use five-year American Community Survey (ACS) estimates. Data under the 2010 heading comes from the 2006 – 2010 ACS, data under the 2019 heading comes from the 2015 – 2019 ACS and data under the 2021 heading comes from 2017 – 2021 ACS .
All content © 2005 – 2024 Furman Center for Real Estate and Urban Policy | Top of page | Contact Us