| Indicator | 2000 | 2006 | 2010 | 2019 | 2021 | 2022 |
|---|---|---|---|---|---|---|
| Population | ||||||
| Born in New York State | 64.4% | 59.0% | 57.5% | 59.4% | ||
| Disabled population | 7.9% | 7.4% | 8.9% | |||
| Foreign-born population | 18.4% | 19.6% | 22.2% | 19.1% | 17.4% | |
| Population | 121,054 | 132,087 | 133,302 | 144,306 | 137,061 | |
| Population aged 65+ | 8.8% | 9.4% | 10.7% | 10.3% | 9.0% | |
| Households | ||||||
| Households with children under 18 years old | 45.0% | 40.5% | 36.1% | 25.9% | 26.3% | |
| Single-person households | 33.0% | 30.9% | 28.3% | 32.9% | ||
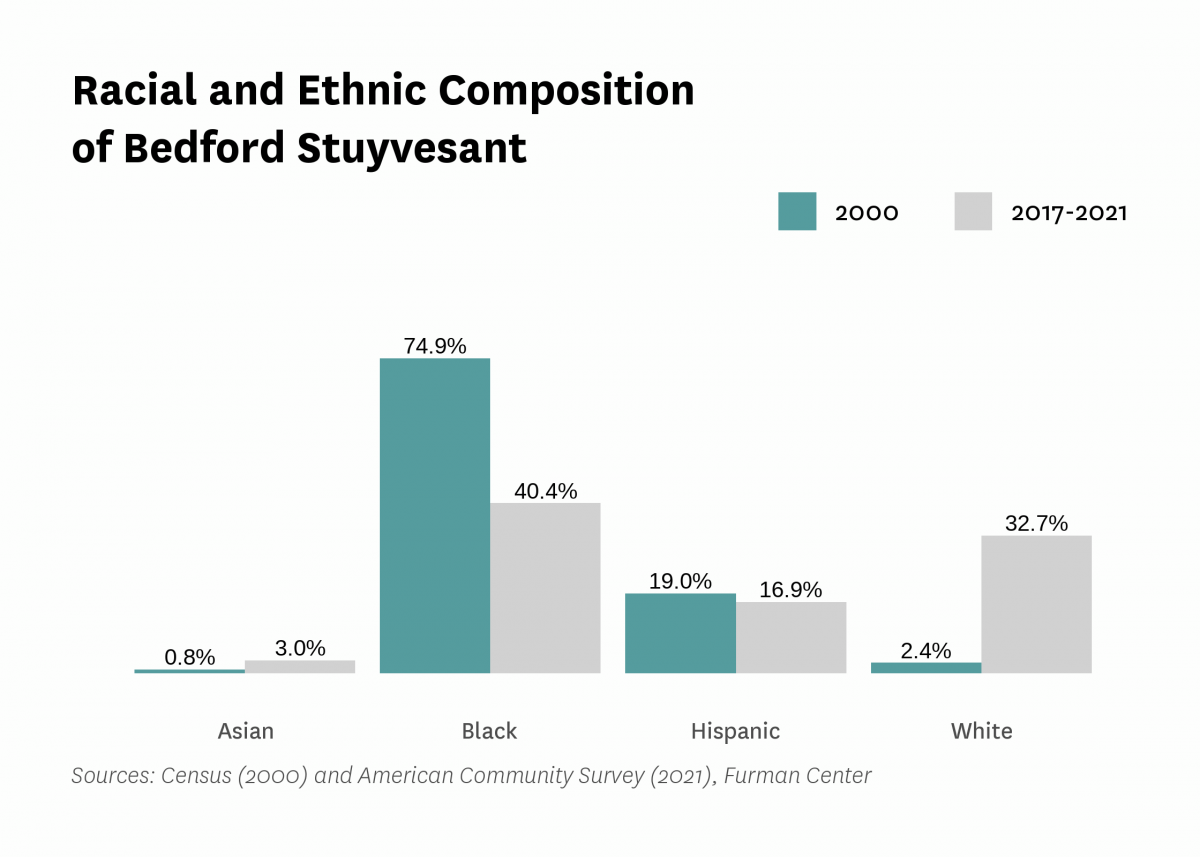
| Race and Ethnicity | ||||||
| Percent Asian | 0.8% | 2.3% | 3.9% | 3.0% | 3.0% | |
| Percent Black | 74.9% | 67.0% | 60.1% | 45.6% | 40.4% | |
| Percent Hispanic | 19.0% | 18.5% | 20.0% | 19.5% | 16.9% | |
| Percent white | 2.4% | 10.4% | 14.6% | 29.4% | 32.7% | |
| Racial diversity index | 0.40 | 0.51 | 0.58 | 0.67 | 0.70 | |
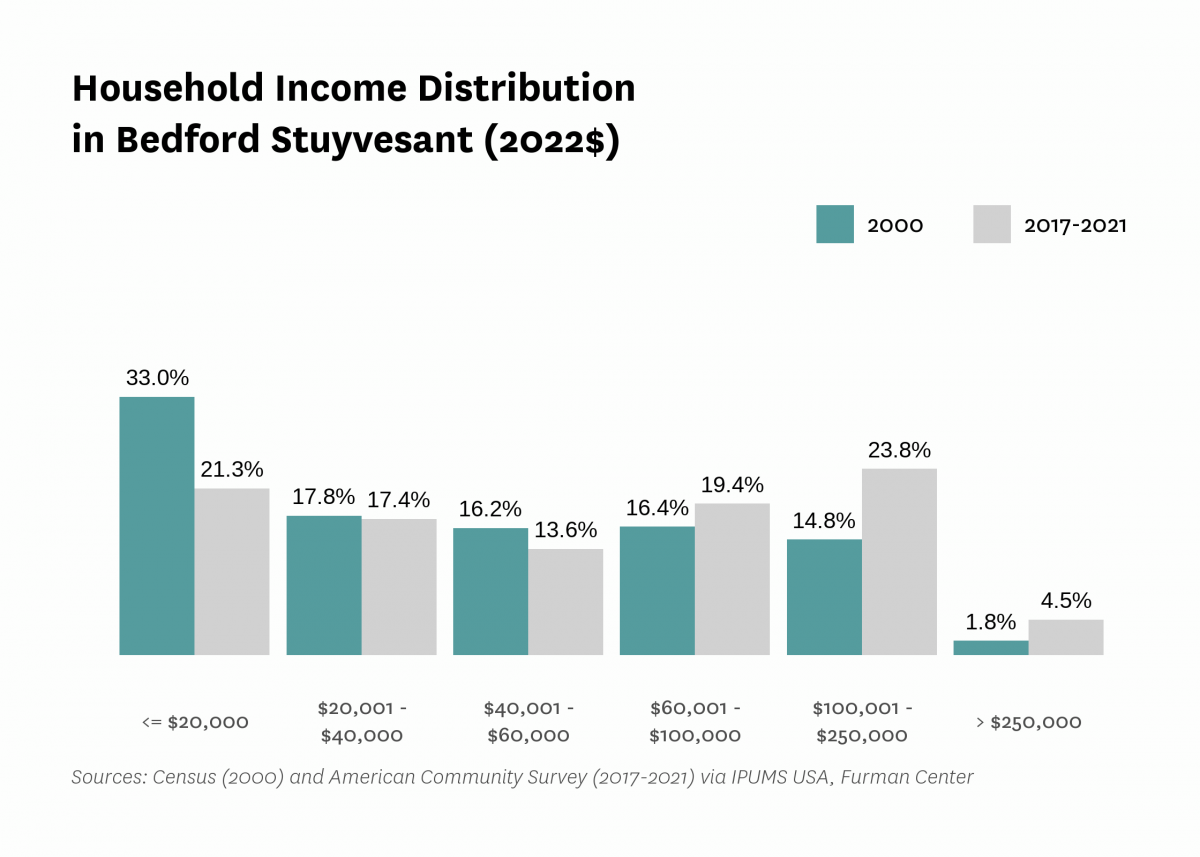
| Income and Poverty | ||||||
| Income diversity ratio | 8.1 | 7.1 | 5.5 | 6.2 | ||
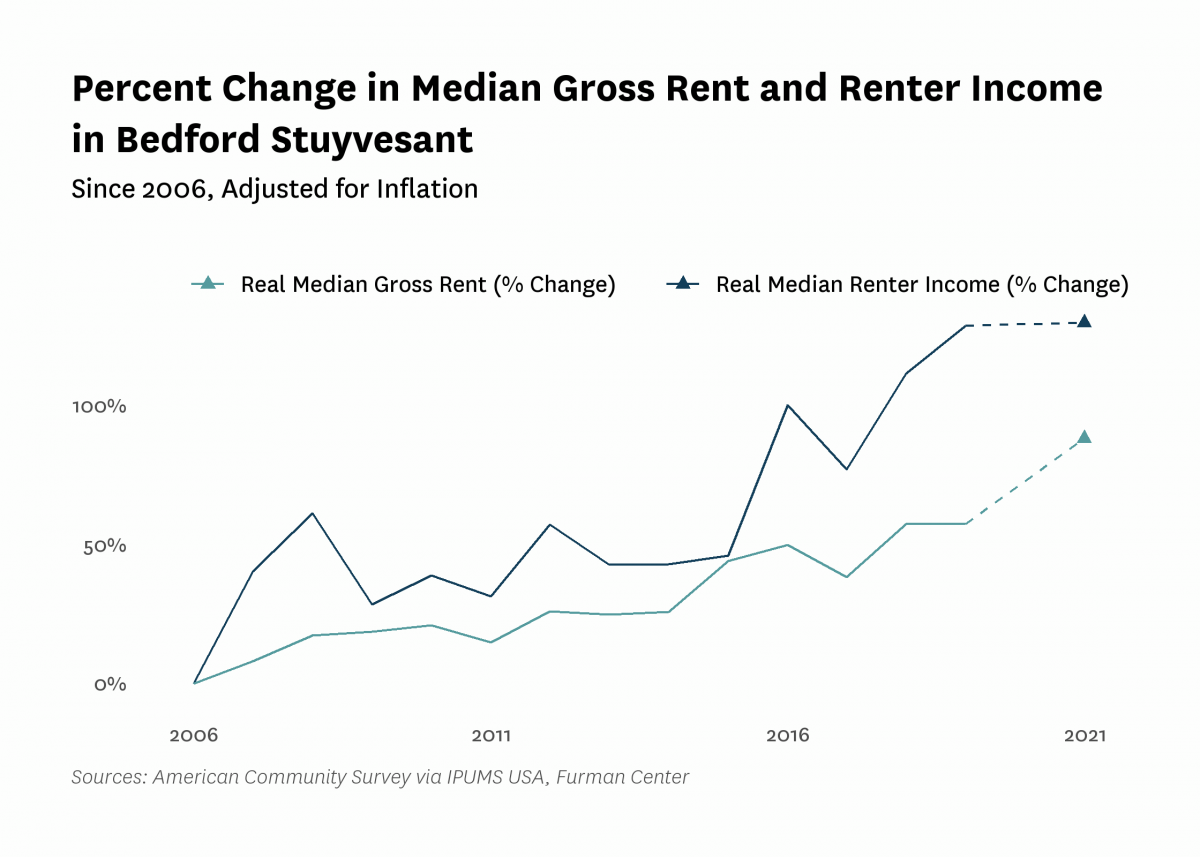
| Median household income (2022$) | $39,950 | $38,780 | $47,620 | $68,220 | $72,810 | |
| Median household income, homeowners (2022$) | $99,850 | $104,920 | $130,370 | $116,720 | ||
| Median household income, renters (2022$) | $24,590 | $34,150 | $56,250 | $56,520 | ||
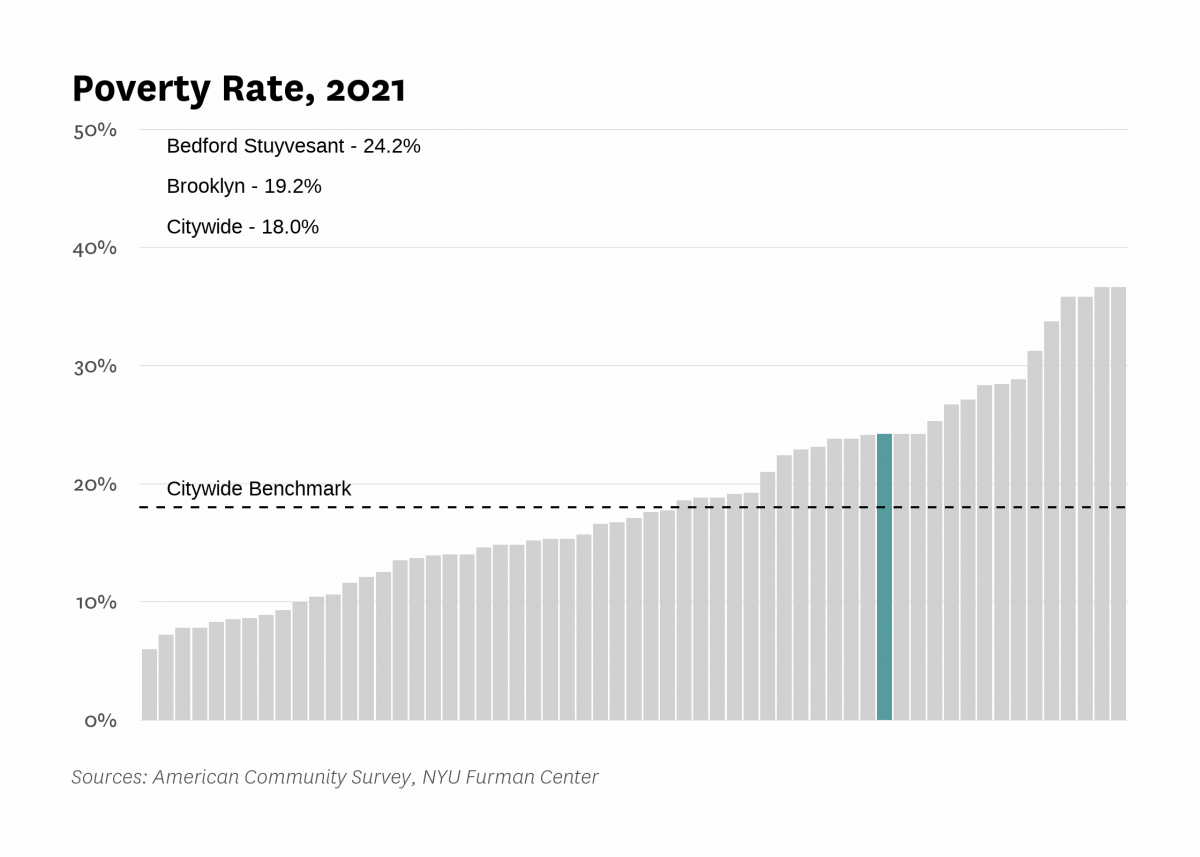
| Poverty rate | 35.9% | 37.7% | 30.7% | 23.0% | 24.2% | |
| Poverty rate, population aged 65+ | 29.2% | 27.8% | 16.8% | 18.5% | ||
| Poverty rate, population under 18 years old | 53.0% | 47.0% | 30.6% | 33.0% | ||
| Labor Market | ||||||
| Labor force participation rate | 57.4% | 58.3% | 66.2% | 68.8% | ||
| Population aged 25+ without a high school diploma | 29.4% | 23.6% | 14.7% | 13.2% | ||
| Unemployment rate | 17.94% | 12.79% | 12.82% | 6.63% | 10.66% | |
| Indicator | 2000 | 2006 | 2010 | 2019 | 2021 | 2022 |
|---|---|---|---|---|---|---|
| Housing Stock | ||||||
| Homeownership rate | 19.2% | 26.1% | 20.4% | 18.4% | 25.8% | |
| Housing units | 50,957 | 56,935 | 61,818 | 54,893 | ||
| Rental vacancy rate | 6.1% | 4.6% | 3.7% | |||
| Serious housing code violations (per 1,000 privately owned rental units) | 130.9 | 103.5 | 116.4 | 112.9 | 109.9 | |
| Severe crowding rate (% of renter households) | 3.2% | 3.4% | 3.2% | |||
| Total housing code violations (per 1,000 privately owned rental units) | 548.0 | 375.4 | 432.6 | 508.1 | 446.3 | |
| Finance - Distress | ||||||
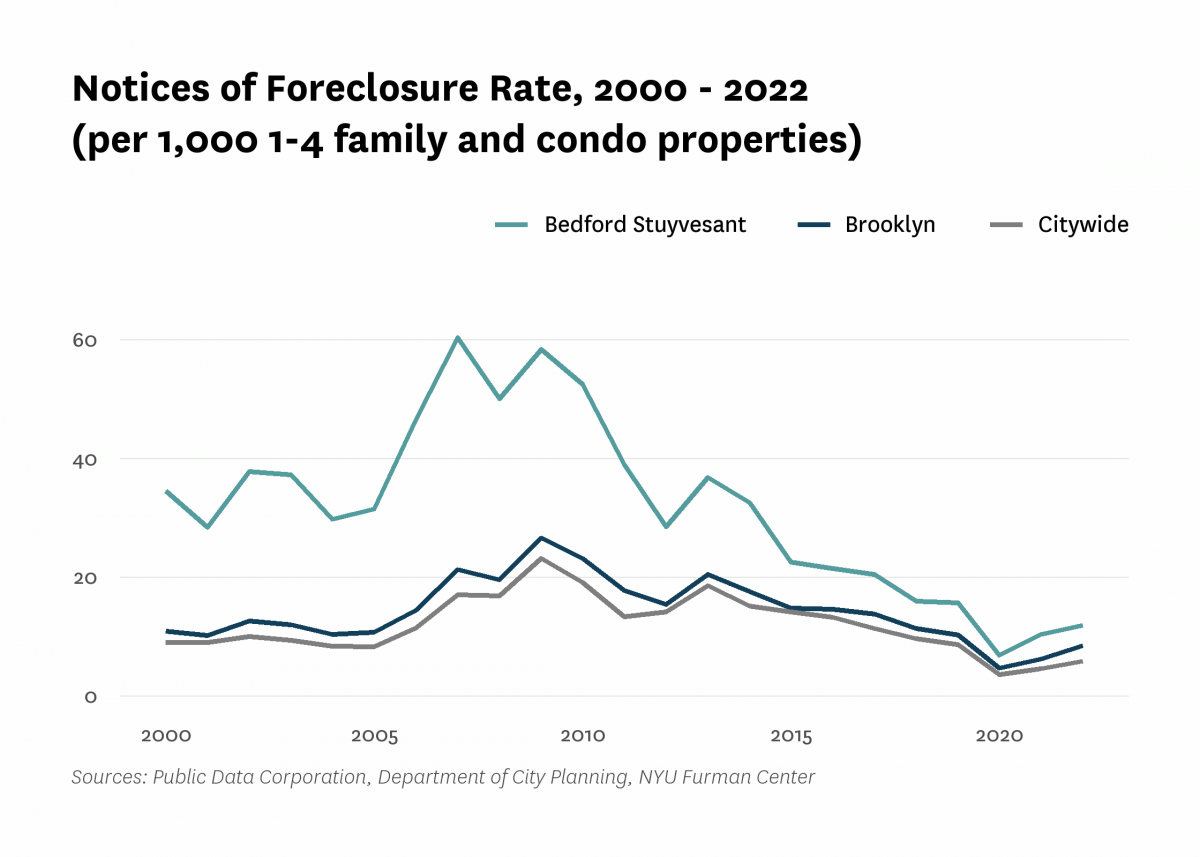
| Notices of foreclosure rate (per 1,000 1-4 family and condo properties) | 34.6 | 46.6 | 52.5 | 15.7 | 10.4 | 11.9 |
| Notices of foreclosure, all residential properties | 473 | 671 | 829 | 255 | 179 | 210 |
| Notices of foreclosure, initial, 1-4 family and condo properties | 301 | 508 | 407 | 111 | 58 | 84 |
| Notices of foreclosure, repeat, 1-4 family and condo properties | 70 | 86 | 310 | 117 | 98 | 99 |
| Pre-foreclosure notice rate (per 1,000 1-4 family and condo properties) | 59.6 | 30.4 | 56.0 | |||
| Pre-foreclosure notices, 1-4 family and condo properties | 867 | 467 | 860 | |||
| Properties entering REO, 1-4 family | 73 | 20 | 29 | |||
| Finance - Lending | ||||||
| FHA/VA-backed home purchase loans (% of home purchase loans) | 1.6% | 65.8% | 0.6% | 2.0% | ||
| Higher-cost home purchase loans (% of home purchase loans) | 44.4% | 2.2% | 0.9% | 0.5% | ||
| Higher-cost refinance loans (% of refinance loans) | 49.2% | 10.9% | 3.0% | 0.8% | ||
| Home purchase loan rate (per 1,000 properties) | 79.9 | 17.8 | 24.0 | 42.3 | ||
| Home purchase loans in LMI tracts (% of home purchase loans) | 93.3% | 4.5% | 60.9% | 63.2% | ||
| Home purchase loans to LMI borrowers (% of home purchase loans) | 4.9% | 89.3% | 0.6% | 3.1% | ||
| Refinance loan rate (per 1,000 properties) | 102.7 | 13.1 | 29.3 | 55.2 | ||
| Sales - Volume | ||||||
| Sales volume, 1 family building | 38 | 82 | 17 | 24 | 25 | 26 |
| Sales volume, 2-4 family building | 459 | 1,052 | 391 | 248 | 206 | 344 |
| Sales volume, 5+ family building | 78 | 110 | 64 | 28 | 42 | 52 |
| Sales volume, condominium | 8 | 256 | 162 | 252 | 427 | 252 |
| Sales volume, all property types | 583 | 1,500 | 634 | 552 | 700 | 674 |
| Sales - Median Prices | ||||||
| Median sales price per unit, 1 family building (2022$) | $343,280 | $698,410 | $421,050 | $1,142,830 | $1,511,960 | $1,475,000 |
| Median sales price per unit, 2-4 family building (2022$) | $169,940 | $357,790 | $208,900 | $608,580 | $646,340 | $673,330 |
| Median sales price per unit, 5+ family building (2022$) | $51,340 | $129,110 | $111,490 | $341,460 | $335,990 | $326,740 |
| Median sales price per unit, condominium (2022$) | $292,940 | $549,310 | $470,680 | $800,450 | $921,010 | $854,200 |
| Sales - Housing Price Index | ||||||
| Index of housing price appreciation, 1 family building | 100.0 | 270.0 | 126.1 | 406.5 | 469.1 | 644.0 |
| Index of housing price appreciation, 2-4 family building | 100.0 | 262.9 | 153.1 | 466.7 | 548.6 | 574.7 |
| Index of housing price appreciation, 5+ family building | 100.0 | 289.0 | 232.4 | 908.6 | 883.8 | 740.8 |
| Index of housing price appreciation, condominium | 100.0 | 238.4 | 182.9 | 430.4 | 460.6 | 471.0 |
| Index of housing price appreciation, all property types | 100.0 | 265.9 | 165.6 | 471.9 | 521.4 | 552.5 |
| Subsidized Housing | ||||||
| Total number of subsidized properties (properties) | 836 | |||||
| HUD Financing or Insurance (properties) | 4 | |||||
| HUD Financing or Insurance (units) | 611 | |||||
| HUD Project-based Rental Assistance Program (properties) | 39 | |||||
| HUD Project-based Rental Assistance Program (units) | 2,384 | |||||
| Low Income Housing Tax Credit (properties) | 180 | |||||
| Low Income Housing Tax Credit (units) | 3,976 | |||||
| Public Housing (properties) | 25 | |||||
| Public Housing (units) | 9,292 | |||||
| Mitchell-Lama (properties) | 18 | |||||
| Mitchell-Lama (units) | 815 | |||||
| 421-a Tax Exemption (properties) | 421 | |||||
| 421-a Tax Exemption (units) | 7,682 | |||||
| 420-c Tax Exemption (properties) | 183 | |||||
| 420-c Tax Exemption (units) | 3,295 | |||||
| NYC Housing Production Programs and Zoning Incentives or Requirements (properties) | 349 | |||||
| Eligible to expire from housing programs between 2023 and 2028 (properties) | 26 | |||||
| Eligible to expire from housing programs between 2023 and 2028 (units) | 713 | |||||
| Eligible to expire from housing programs between 2029 and 2038 (properties) | 81 | |||||
| Eligible to expire from housing programs between 2029 and 2038 (units) | 1,614 | |||||
| Eligible to expire from housing programs in 2039 and later (properties) | 89 | |||||
| Eligible to expire from housing programs in 2039 and later (units) | 2,884 | |||||
| Indicator | 2000 | 2006 | 2010 | 2019 | 2021 | 2022 |
|---|---|---|---|---|---|---|
| Density | ||||||
| Population density (1,000 persons per square mile) | 57.5 | 58.0 | 62.8 | 59.7 | ||
| Development | ||||||
| Units authorized by new residential building permits | 125 | 0 | 255 | 496 | 749 | 1,883 |
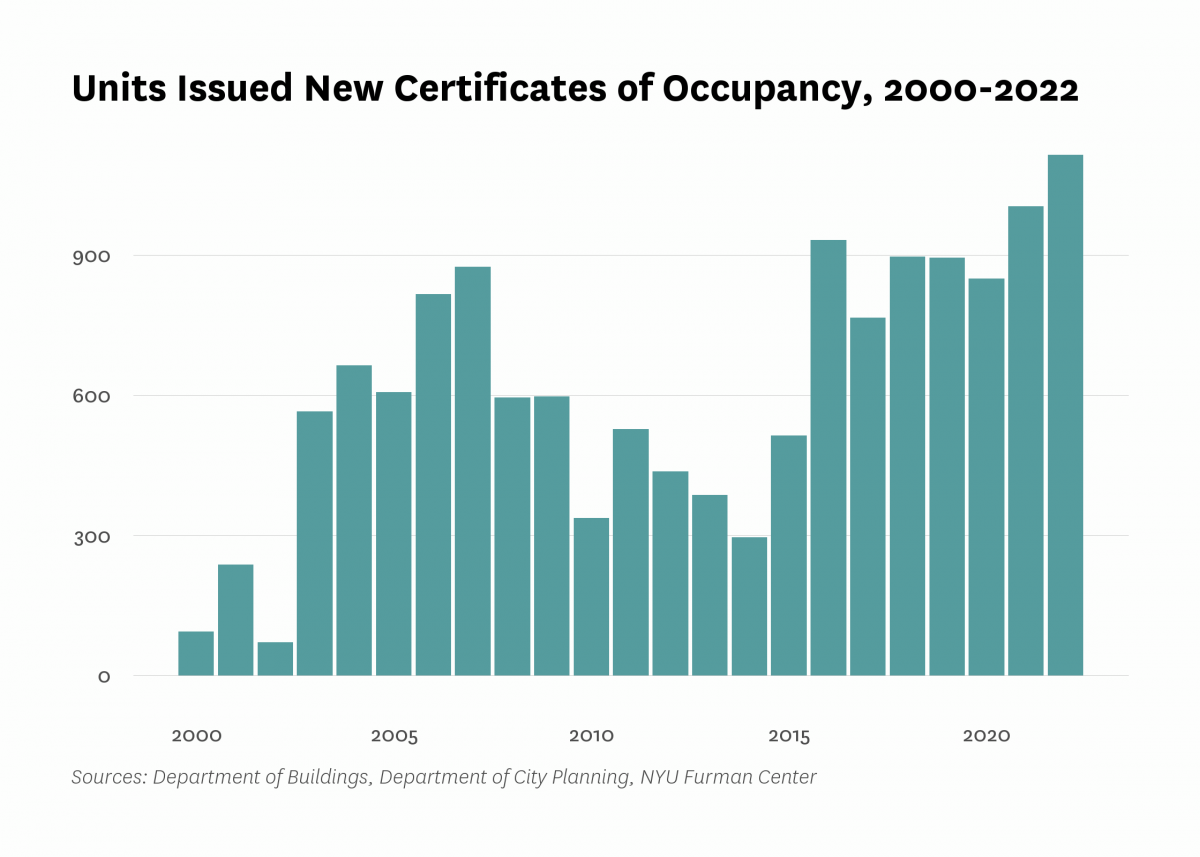
| Units issued new certificates of occupancy | 94 | 816 | 337 | 894 | 1,004 | 1,114 |
| Indicator | 2000 | 2006 | 2010 | 2019 | 2021 | 2022 |
|---|---|---|---|---|---|---|
| Commute | ||||||
| Car-free commute (% of commuters) | 73.4% | 74.8% | 80.6% | 83.0% | 73.0% | |
| Mean travel time to work (minutes) | 44.7 | 40.0 | 39.6 | 41.4 | 38.8 | |
| Crime and Incarceration | ||||||
| Serious crime rate (per 1,000 residents) | 22.6 | 21.1 | 18.5 | 14.3 | 15.3 | |
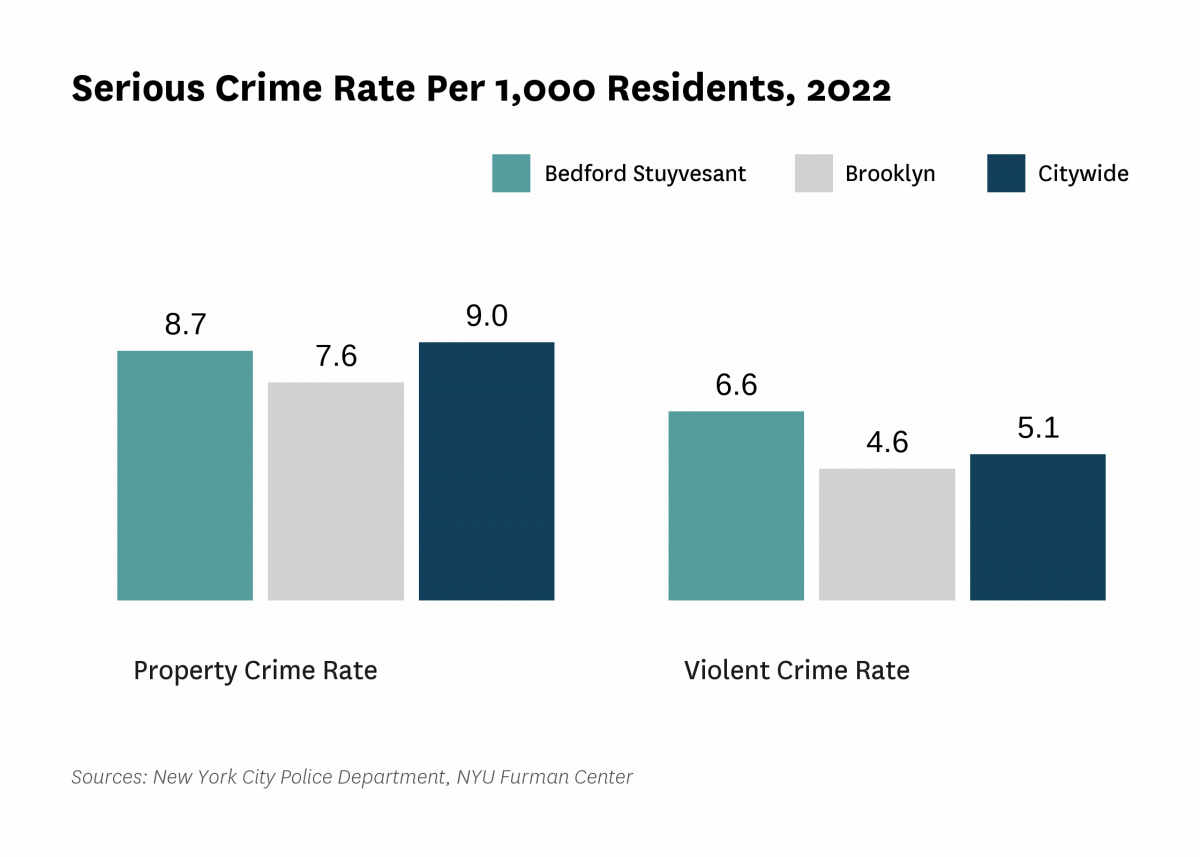
| Serious crime rate, property (per 1,000 residents) | 11.2 | 10.8 | 11.0 | 7.8 | 8.7 | |
| Serious crime rate, violent (per 1,000 residents) | 11.4 | 10.2 | 7.5 | 6.4 | 6.6 | |
| Schools | ||||||
| Students performing at grade level in English language arts, 4th grade | 41.6% | 36.7% | ||||
| Students performing at grade level in math, 4th grade | 38.2% | 30.2% | ||||
| Indicator | 2000 | 2006 | 2010 | 2019 | 2021 | 2022 |
|---|---|---|---|---|---|---|
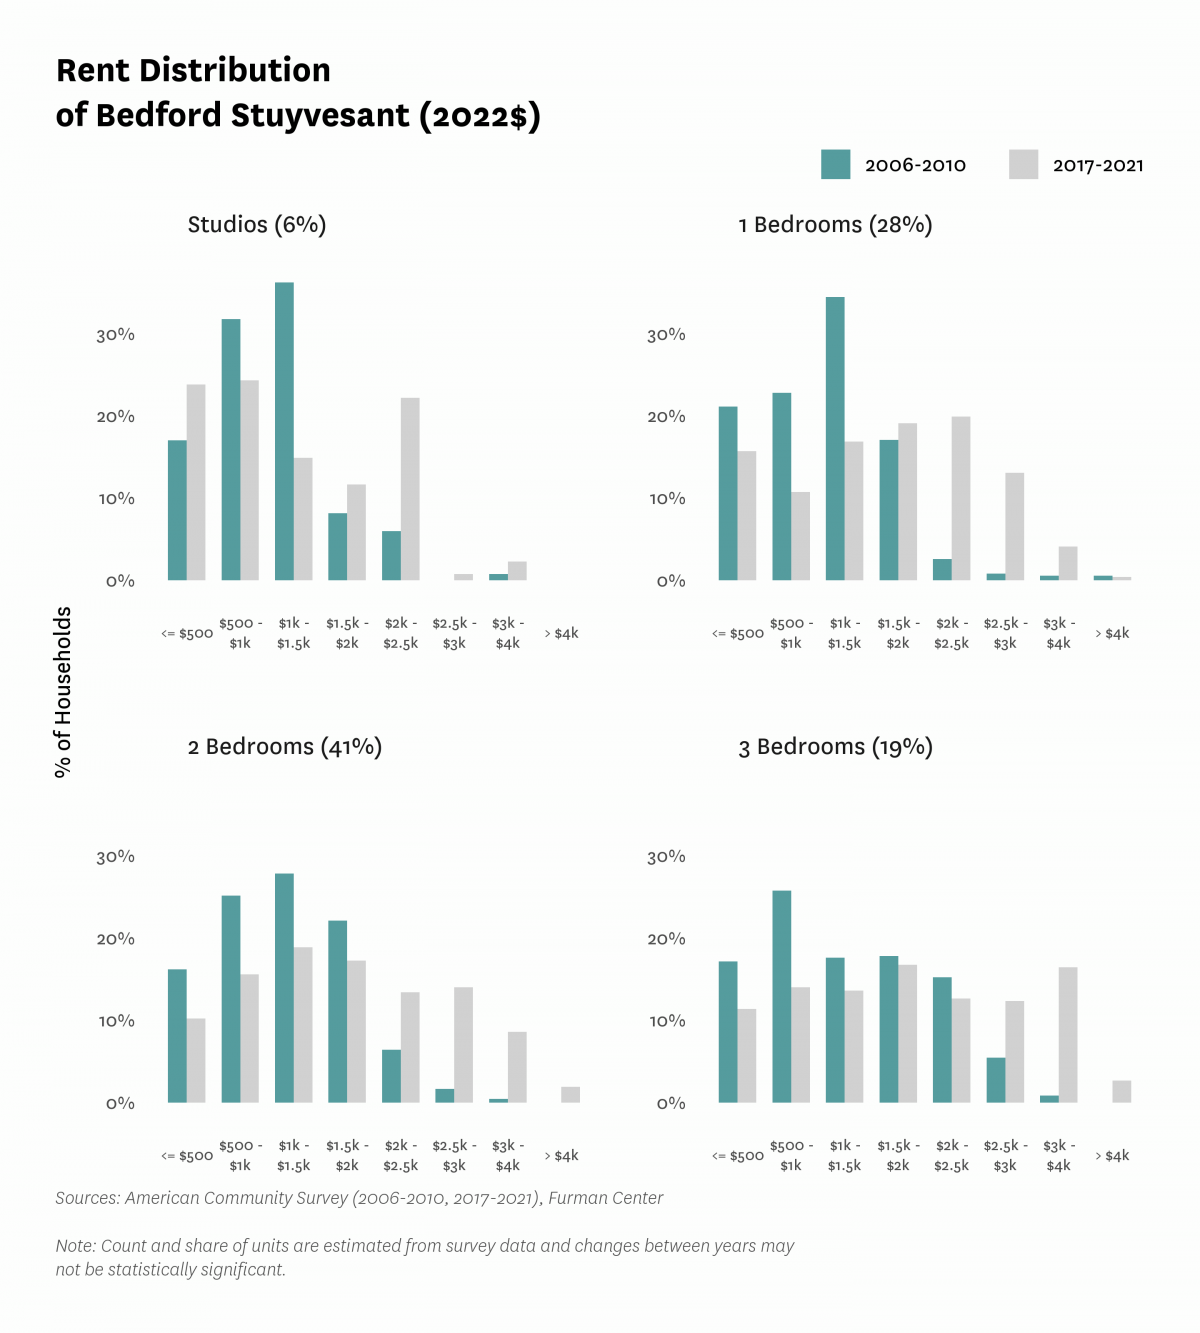
| Median Rent | ||||||
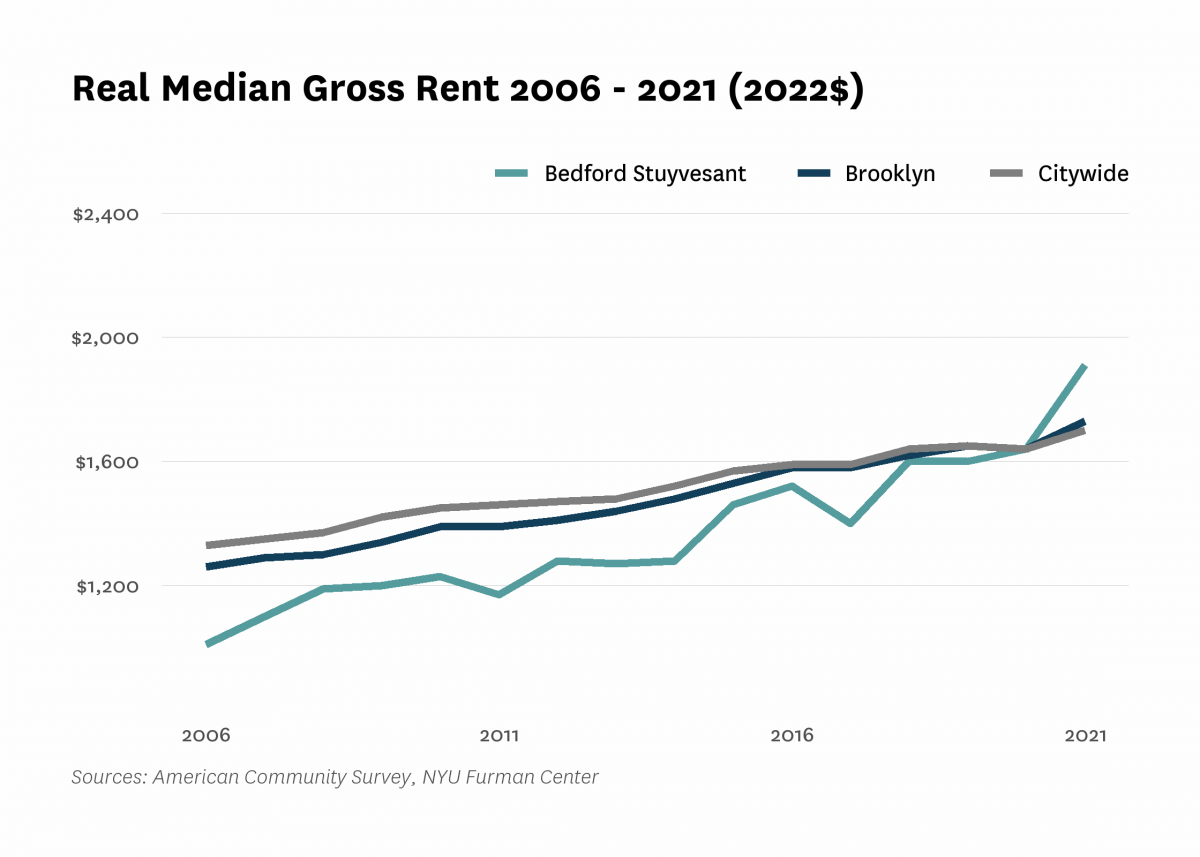
| Median rent, 2- and 3-bedrooms (2022$) | $1,220 | $1,520 | $1,750 | |||
| Median rent, all (2022$) | $900 | $1,010 | $1,230 | $1,600 | $1,910 | |
| Median rent, recent movers (2022$) | $1,530 | $2,230 | $2,470 | |||
| Median rent, studios and 1-bedrooms (2022$) | $1,110 | $1,400 | $1,620 | |||
| Change in collected rent (2019-2020) | 1.4% | |||||
| Affordability | ||||||
| Rental units affordable at 30% AMI (% of recently available units) | 9.7% | 9.6% | 9.8% | |||
| Rental units affordable at 80% AMI (% of recently available units) | 63.9% | 40.1% | 36.0% | |||
| Rental units affordable at 120% AMI (% of recently available units) | 97.0% | 90.2% | 90.8% | |||
| Rent Burden | ||||||
| Moderately rent-burdened households | 21.8% | 24.1% | 26.4% | 21.2% | ||
| Moderately rent-burdened households, low income | 26.4% | 28.6% | 27.7% | |||
| Moderately rent-burdened households, moderate income | 17.2% | 34.9% | 30.9% | |||
| Severely rent-burdened households | 28.8% | 32.4% | 27.5% | 27.7% | ||
| Severely rent-burdened households, low income | 43.8% | 40.9% | 44.5% | |||
| Severely rent-burdened households, moderate income | 0.0% | 1.7% | 1.5% | |||
| Rental Subsidy | ||||||
| Housing choice vouchers (% of occupied, privately owned rental units) | 12.6% | 7.3% | ||||
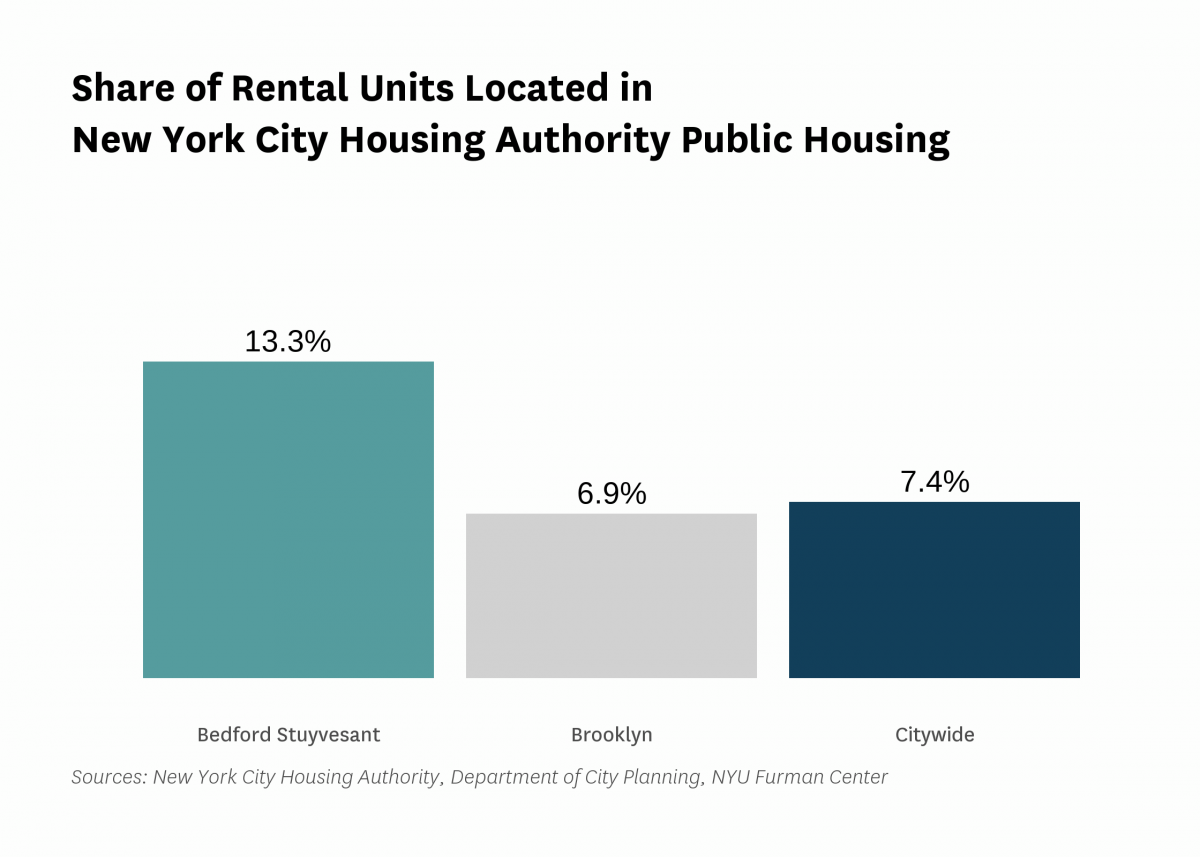
| Public housing (% of rental units) | 13.3% | |||||
Data Notes: See CoreData User Guide for more information about indicator definitions and methods.
Indicators: The rental vacancy rate, severe crowding rate, and the severely rent-burdened households indicators use five-year American Community Survey (ACS) estimates. Data under the 2010 heading comes from the 2006 – 2010 ACS, data under the 2019 heading comes from the 2015 – 2019 ACS and data under the 2021 heading comes from 2017 – 2021 ACS .
All content © 2005 – 2024 Furman Center for Real Estate and Urban Policy | Top of page | Contact Us