| Indicator | 2000 | 2006 | 2010 | 2019 | 2021 | 2022 |
|---|---|---|---|---|---|---|
| Population | ||||||
| Born in New York State | 42.3% | 40.5% | 44.0% | 42.7% | ||
| Disabled population | 5.8% | 5.7% | 8.2% | |||
| Foreign-born population | 46.0% | 46.2% | 44.9% | 35.5% | 37.1% | |
| Population | 205,469 | 190,247 | 166,666 | 166,069 | 156,981 | |
| Population aged 65+ | 10.9% | 11.9% | 11.7% | 13.7% | 13.9% | |
| Households | ||||||
| Households with children under 18 years old | 28.5% | 25.3% | 23.9% | 17.4% | 14.9% | |
| Single-person households | 34.8% | 32.8% | 34.9% | 38.3% | ||
| Race and Ethnicity | ||||||
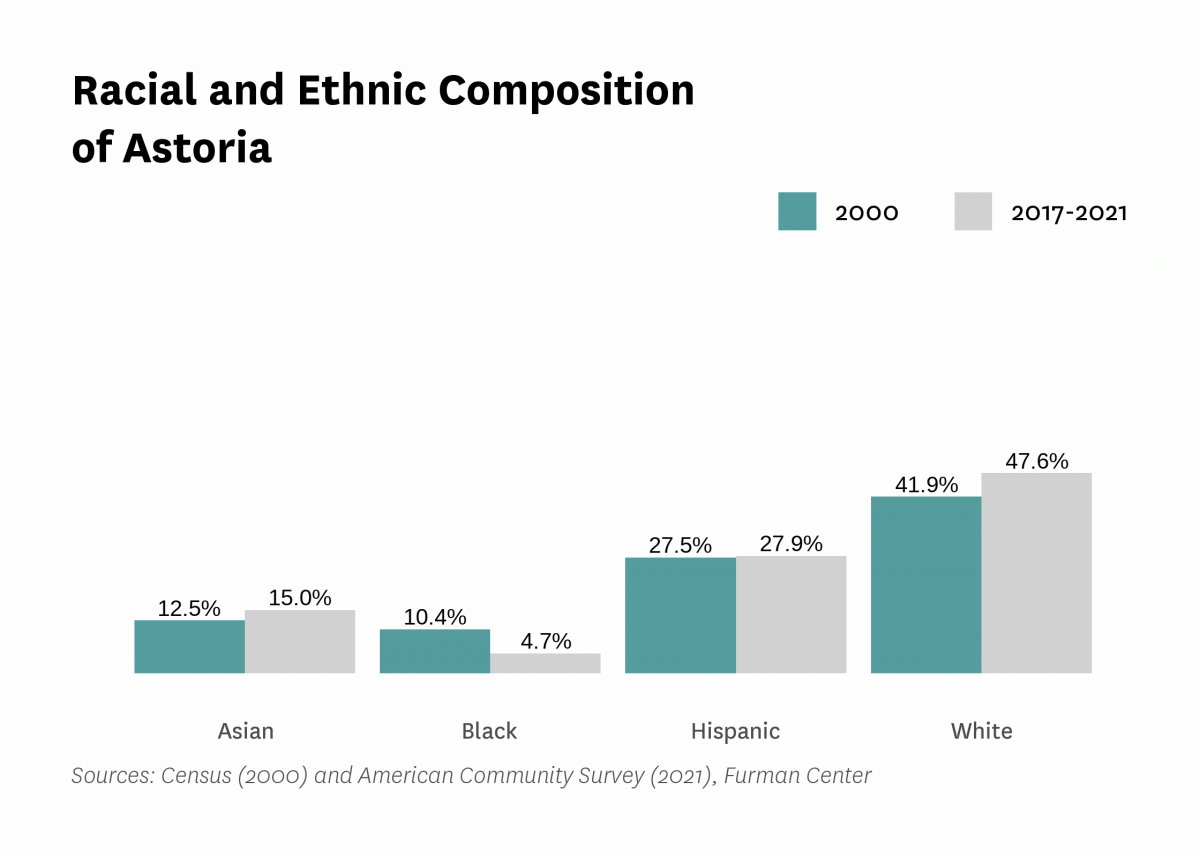
| Percent Asian | 12.5% | 13.0% | 14.5% | 14.7% | 15.0% | |
| Percent Black | 10.4% | 6.7% | 6.9% | 5.2% | 4.7% | |
| Percent Hispanic | 27.5% | 31.3% | 29.2% | 27.4% | 27.9% | |
| Percent white | 41.9% | 45.8% | 46.6% | 49.5% | 47.6% | |
| Racial diversity index | 0.72 | 0.67 | 0.67 | 0.66 | 0.67 | |
| Income and Poverty | ||||||
| Income diversity ratio | 4.4 | 4.7 | 4.8 | 4.9 | ||
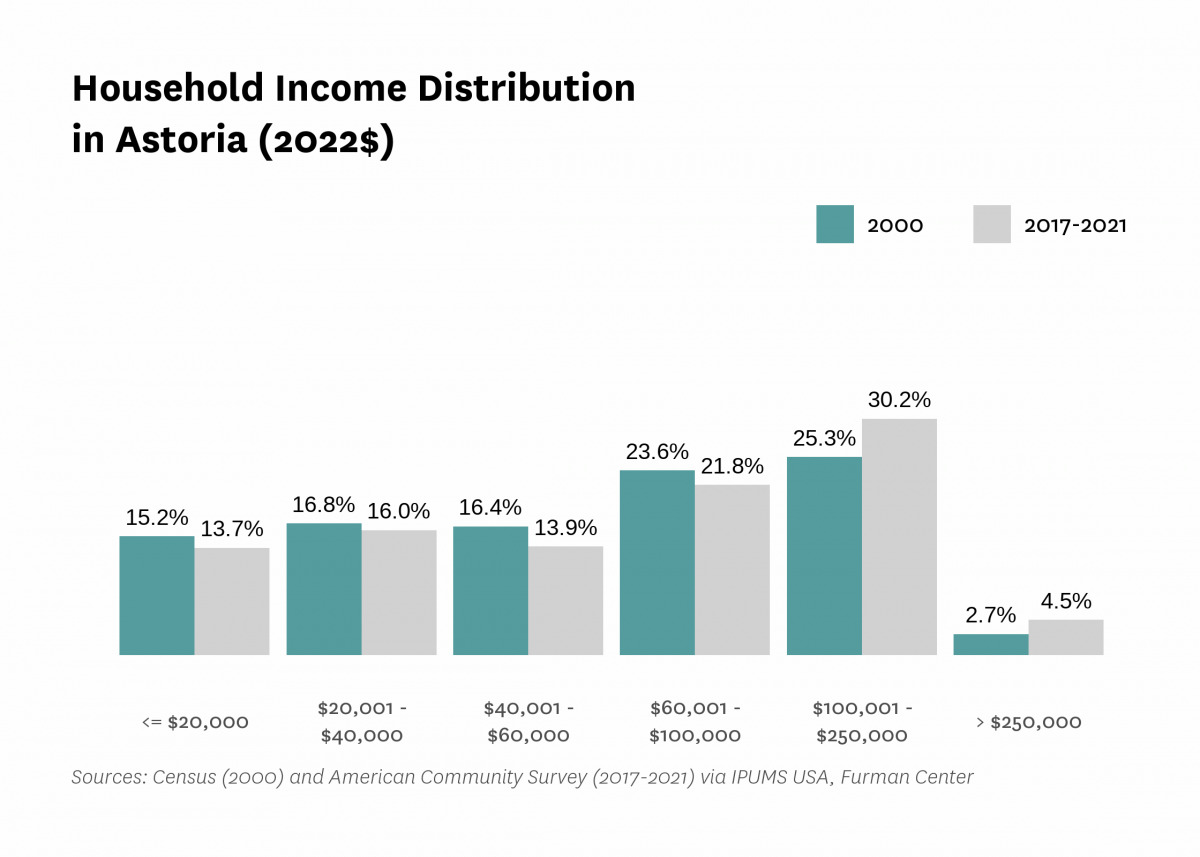
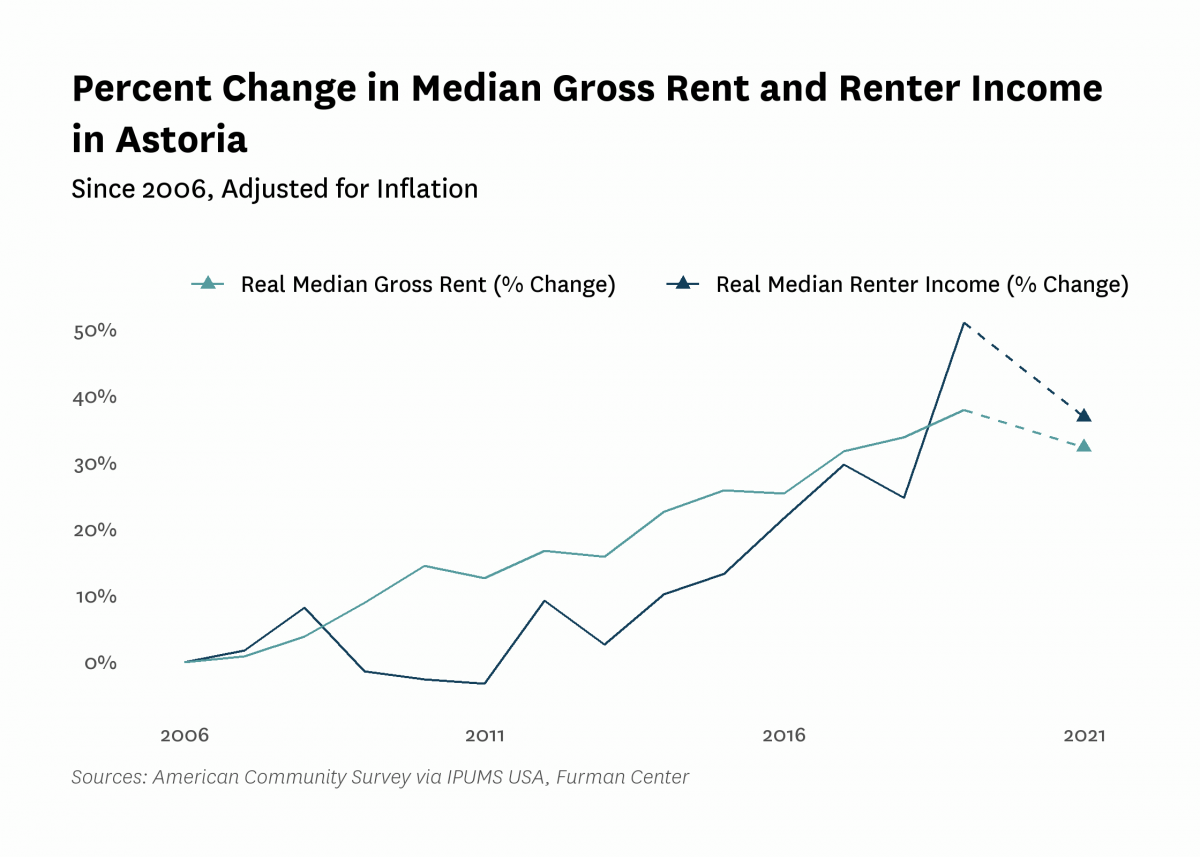
| Median household income (2022$) | $64,240 | $59,180 | $59,910 | $88,280 | $78,030 | |
| Median household income, homeowners (2022$) | $75,320 | $78,500 | $101,480 | $79,010 | ||
| Median household income, renters (2022$) | $56,580 | $55,120 | $85,470 | $77,440 | ||
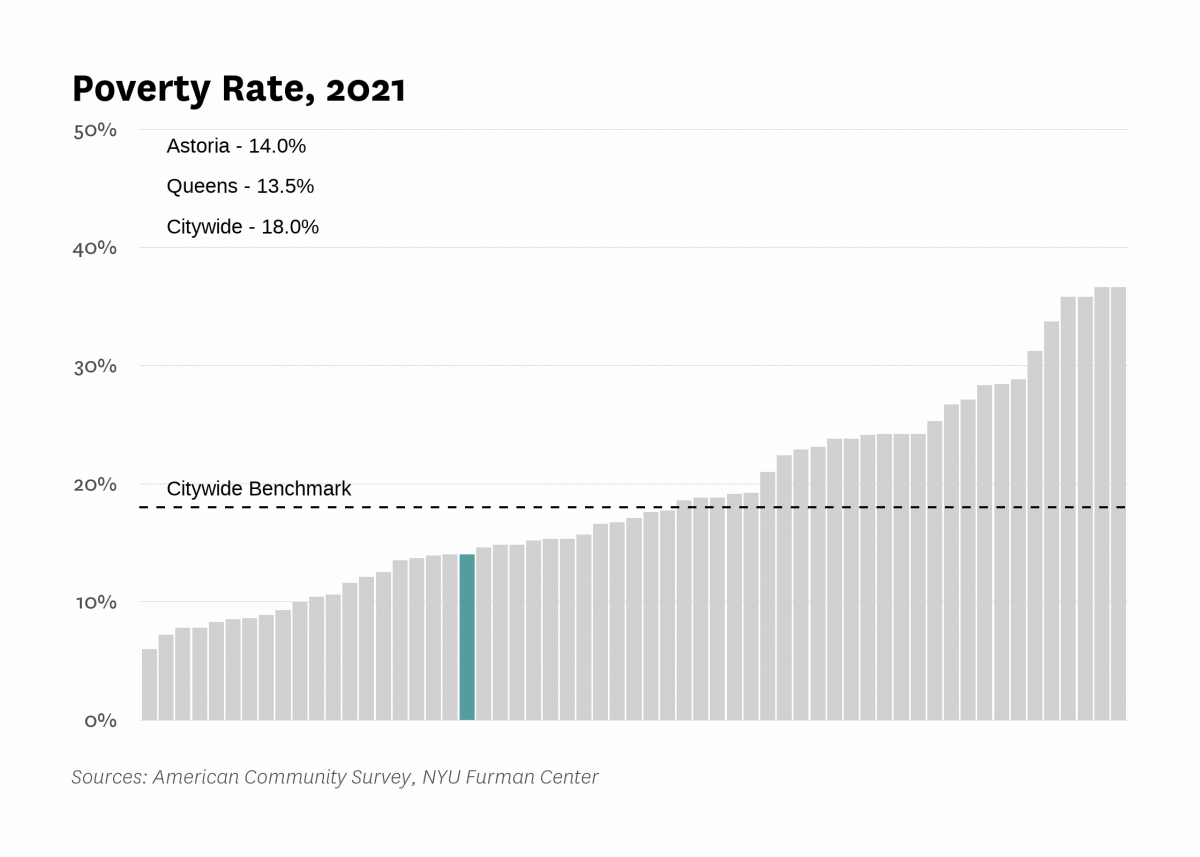
| Poverty rate | 20.3% | 17.2% | 19.0% | 11.6% | 14.0% | |
| Poverty rate, population aged 65+ | 21.1% | 13.3% | 18.3% | 14.5% | ||
| Poverty rate, population under 18 years old | 29.8% | 30.2% | 17.1% | 18.8% | ||
| Labor Market | ||||||
| Labor force participation rate | 65.9% | 69.3% | 71.4% | 69.1% | ||
| Population aged 25+ without a high school diploma | 22.2% | 19.4% | 11.5% | 10.7% | ||
| Unemployment rate | 7.82% | 10.12% | 13.00% | 3.37% | 13.06% | |
| Indicator | 2000 | 2006 | 2010 | 2019 | 2021 | 2022 |
|---|---|---|---|---|---|---|
| Housing Stock | ||||||
| Homeownership rate | 20.0% | 20.3% | 18.1% | 18.9% | 18.9% | |
| Housing units | 81,353 | 77,318 | 90,017 | 95,762 | ||
| Rental vacancy rate | 2.2% | 1.8% | 3.3% | |||
| Serious housing code violations (per 1,000 privately owned rental units) | 16.0 | 10.7 | 22.7 | 24.2 | 32.9 | |
| Severe crowding rate (% of renter households) | 3.3% | 2.8% | 3.6% | |||
| Total housing code violations (per 1,000 privately owned rental units) | 105.4 | 65.5 | 87.8 | 144.5 | 165.4 | |
| Finance - Distress | ||||||
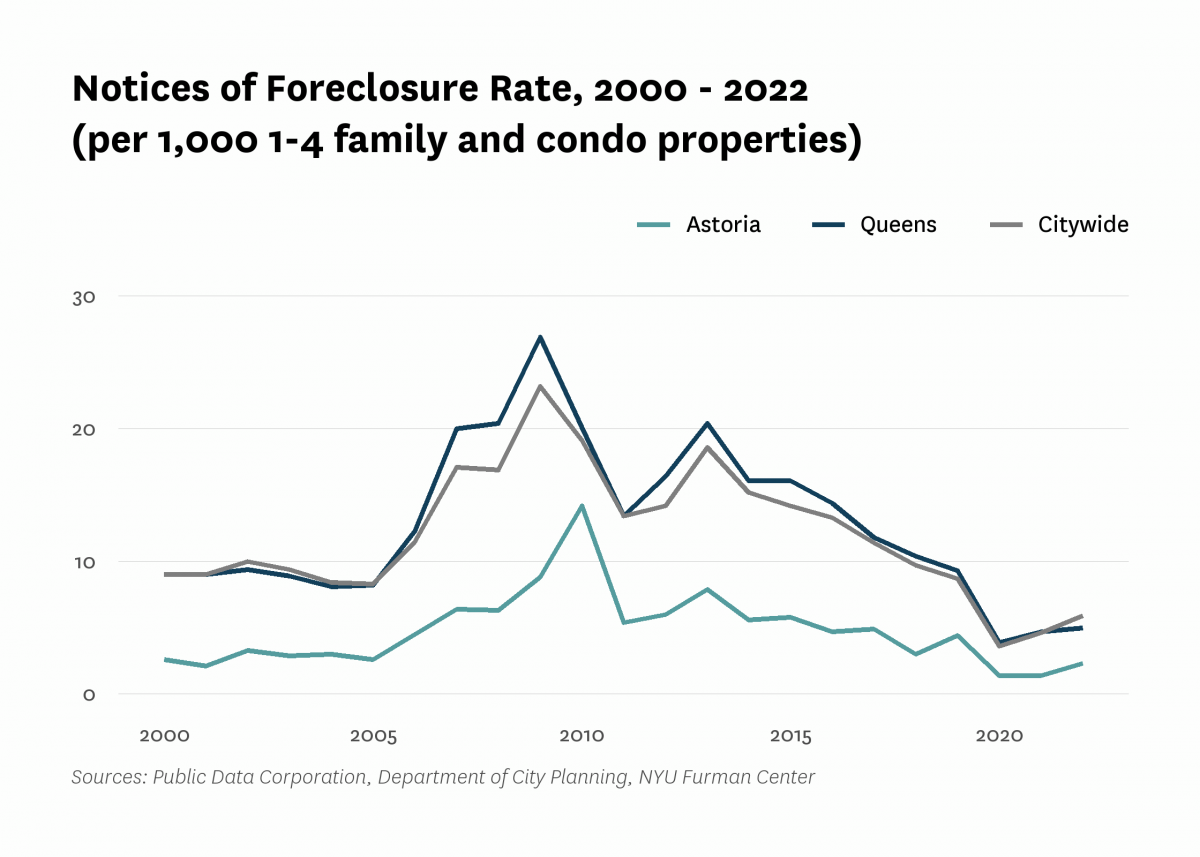
| Notices of foreclosure rate (per 1,000 1-4 family and condo properties) | 2.6 | 4.5 | 14.2 | 4.4 | 1.4 | 2.3 |
| Notices of foreclosure, all residential properties | 45 | 74 | 238 | 75 | 27 | 46 |
| Notices of foreclosure, initial, 1-4 family and condo properties | 32 | 56 | 200 | 31 | 11 | 21 |
| Notices of foreclosure, repeat, 1-4 family and condo properties | 6 | 10 | 21 | 39 | 12 | 16 |
| Pre-foreclosure notice rate (per 1,000 1-4 family and condo properties) | 17.7 | 10.8 | 24.8 | |||
| Pre-foreclosure notices, 1-4 family and condo properties | 281 | 176 | 405 | |||
| Properties entering REO, 1-4 family | 5 | 1 | 5 | |||
| Finance - Lending | ||||||
| FHA/VA-backed home purchase loans (% of home purchase loans) | 0.0% | 22.0% | 1.1% | 0.7% | ||
| Higher-cost home purchase loans (% of home purchase loans) | 15.2% | 1.0% | 1.1% | 1.2% | ||
| Higher-cost refinance loans (% of refinance loans) | 23.1% | 3.1% | 3.8% | 0.7% | ||
| Home purchase loan rate (per 1,000 properties) | 31.4 | 16.9 | 15.3 | 30.6 | ||
| Home purchase loans in LMI tracts (% of home purchase loans) | 36.2% | 7.1% | 22.6% | 27.5% | ||
| Home purchase loans to LMI borrowers (% of home purchase loans) | 3.6% | 34.7% | 2.6% | 4.0% | ||
| Refinance loan rate (per 1,000 properties) | 27.2 | 12.5 | 13.1 | 33.0 | ||
| Sales - Volume | ||||||
| Sales volume, 1 family building | 93 | 108 | 43 | 46 | 68 | 76 |
| Sales volume, 2-4 family building | 299 | 325 | 134 | 128 | 165 | 246 |
| Sales volume, 5+ family building | 69 | 59 | 44 | 45 | 48 | 51 |
| Sales volume, condominium | 36 | 164 | 132 | 123 | 196 | 134 |
| Sales volume, all property types | 497 | 656 | 353 | 342 | 477 | 507 |
| Sales - Median Prices | ||||||
| Median sales price per unit, 1 family building (2022$) | $424,850 | $786,950 | $708,190 | $1,038,300 | $1,029,190 | $995,000 |
| Median sales price per unit, 2-4 family building (2022$) | $236,220 | $463,740 | $386,290 | $639,710 | $583,560 | $575,000 |
| Median sales price per unit, 5+ family building (2022$) | $94,320 | $196,740 | $193,140 | $318,810 | $279,400 | $258,330 |
| Median sales price per unit, condominium (2022$) | $231,540 | $464,840 | $457,100 | $690,160 | $636,620 | $612,500 |
| Sales - Housing Price Index | ||||||
| Index of housing price appreciation, 1 family building | 100.0 | 236.7 | 193.3 | 379.6 | 401.4 | 422.5 |
| Index of housing price appreciation, 2-4 family building | 100.0 | 234.5 | 204.0 | 451.4 | 416.8 | 409.0 |
| Index of housing price appreciation, 5+ family building | 100.0 | 268.2 | 251.9 | 502.4 | 491.6 | 603.6 |
| Index of housing price appreciation, condominium | 100.0 | 252.1 | 236.9 | 391.5 | 386.4 | 403.9 |
| Index of housing price appreciation, all property types | 100.0 | 242.2 | 218.6 | 414.6 | 404.8 | 427.6 |
| Subsidized Housing | ||||||
| Total number of subsidized properties (properties) | 105 | |||||
| HUD Financing or Insurance (properties) | 1 | |||||
| HUD Financing or Insurance (units) | 241 | |||||
| HUD Project-based Rental Assistance Program (properties) | 15 | |||||
| HUD Project-based Rental Assistance Program (units) | 1,168 | |||||
| Low Income Housing Tax Credit (properties) | 8 | |||||
| Low Income Housing Tax Credit (units) | 765 | |||||
| Public Housing (properties) | 12 | |||||
| Public Housing (units) | 7,584 | |||||
| Mitchell-Lama (properties) | 2 | |||||
| Mitchell-Lama (units) | 379 | |||||
| 421-a Tax Exemption (properties) | 329 | |||||
| 421-a Tax Exemption (units) | 9,060 | |||||
| 420-c Tax Exemption (properties) | 10 | |||||
| 420-c Tax Exemption (units) | 650 | |||||
| NYC Housing Production Programs and Zoning Incentives or Requirements (properties) | 50 | |||||
| Eligible to expire from housing programs between 2023 and 2028 (properties) | 5 | |||||
| Eligible to expire from housing programs between 2023 and 2028 (units) | 393 | |||||
| Eligible to expire from housing programs between 2029 and 2038 (properties) | 5 | |||||
| Eligible to expire from housing programs between 2029 and 2038 (units) | 328 | |||||
| Eligible to expire from housing programs in 2039 and later (properties) | 8 | |||||
| Eligible to expire from housing programs in 2039 and later (units) | 696 | |||||
| Indicator | 2000 | 2006 | 2010 | 2019 | 2021 | 2022 |
|---|---|---|---|---|---|---|
| Density | ||||||
| Population density (1,000 persons per square mile) | 36.9 | 32.3 | 32.2 | 30.5 | ||
| Development | ||||||
| Units authorized by new residential building permits | 242 | 3 | 360 | 1,688 | 371 | 3,287 |
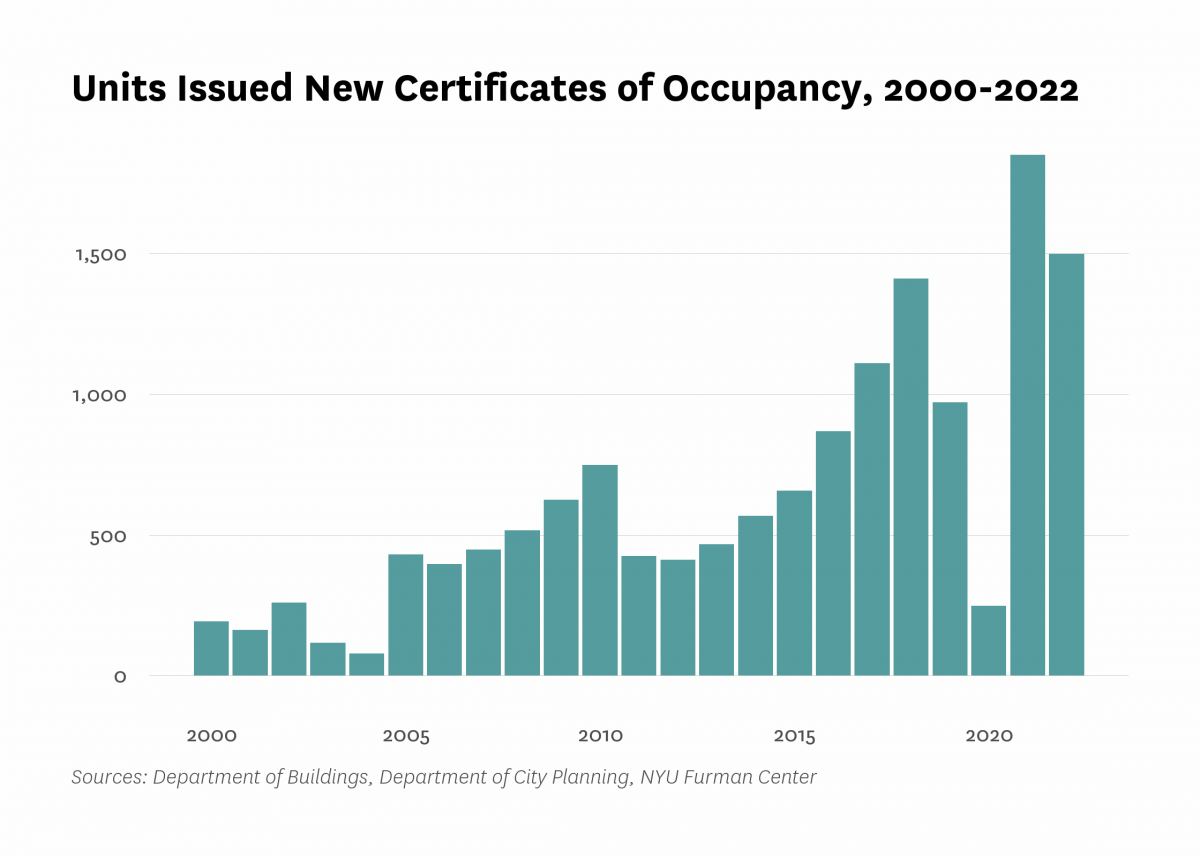
| Units issued new certificates of occupancy | 193 | 397 | 749 | 972 | 1,850 | 1,498 |
| Indicator | 2000 | 2006 | 2010 | 2019 | 2021 | 2022 |
|---|---|---|---|---|---|---|
| Commute | ||||||
| Car-free commute (% of commuters) | 70.9% | 77.5% | 75.3% | 78.9% | 71.0% | |
| Mean travel time to work (minutes) | 36.2 | 36.3 | 36.1 | 39.5 | 36.2 | |
| Crime and Incarceration | ||||||
| Serious crime rate (per 1,000 residents) | 10.7 | 10.4 | 8.5 | 9.4 | 11.1 | |
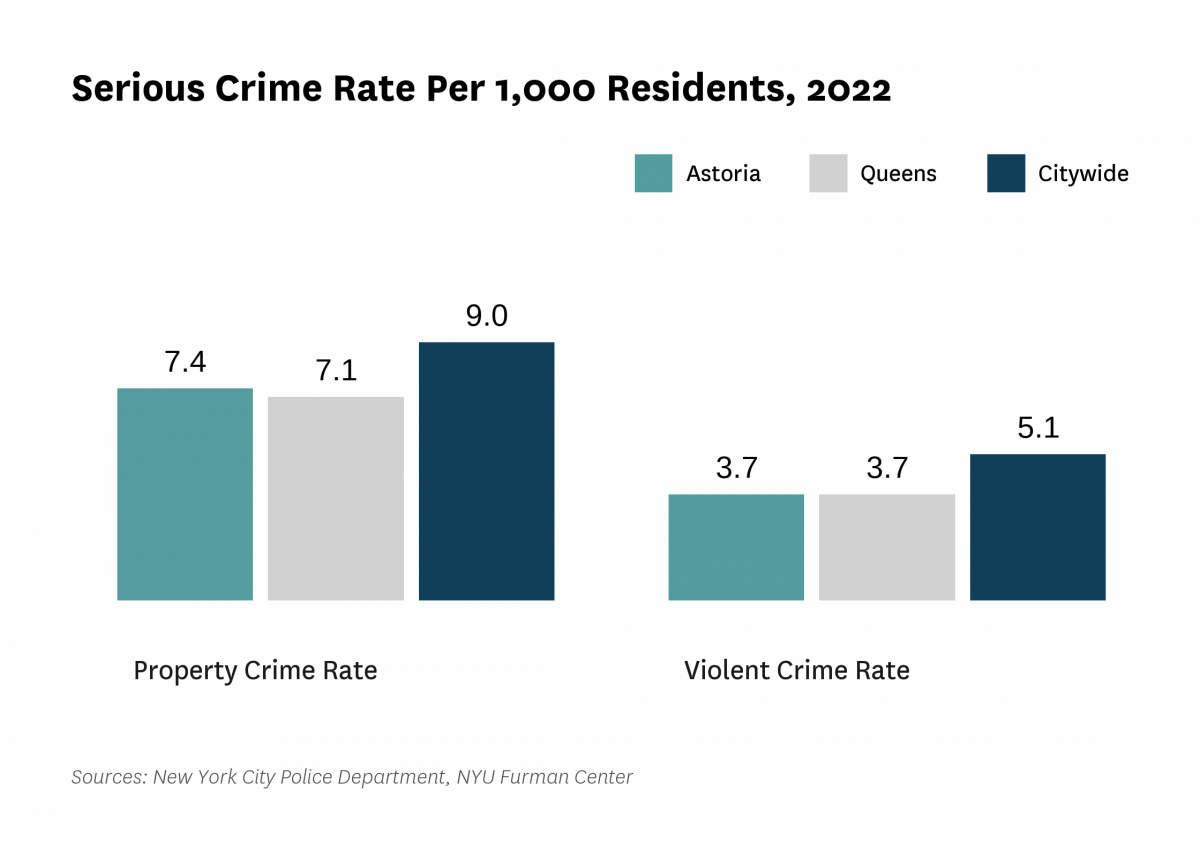
| Serious crime rate, property (per 1,000 residents) | 7.6 | 7.2 | 5.7 | 6.3 | 7.4 | |
| Serious crime rate, violent (per 1,000 residents) | 3.1 | 3.2 | 2.8 | 3.1 | 3.7 | |
| Schools | ||||||
| Students performing at grade level in English language arts, 4th grade | 60.4% | 54.9% | ||||
| Students performing at grade level in math, 4th grade | 59.2% | 50.1% | ||||
| Indicator | 2000 | 2006 | 2010 | 2019 | 2021 | 2022 |
|---|---|---|---|---|---|---|
| Median Rent | ||||||
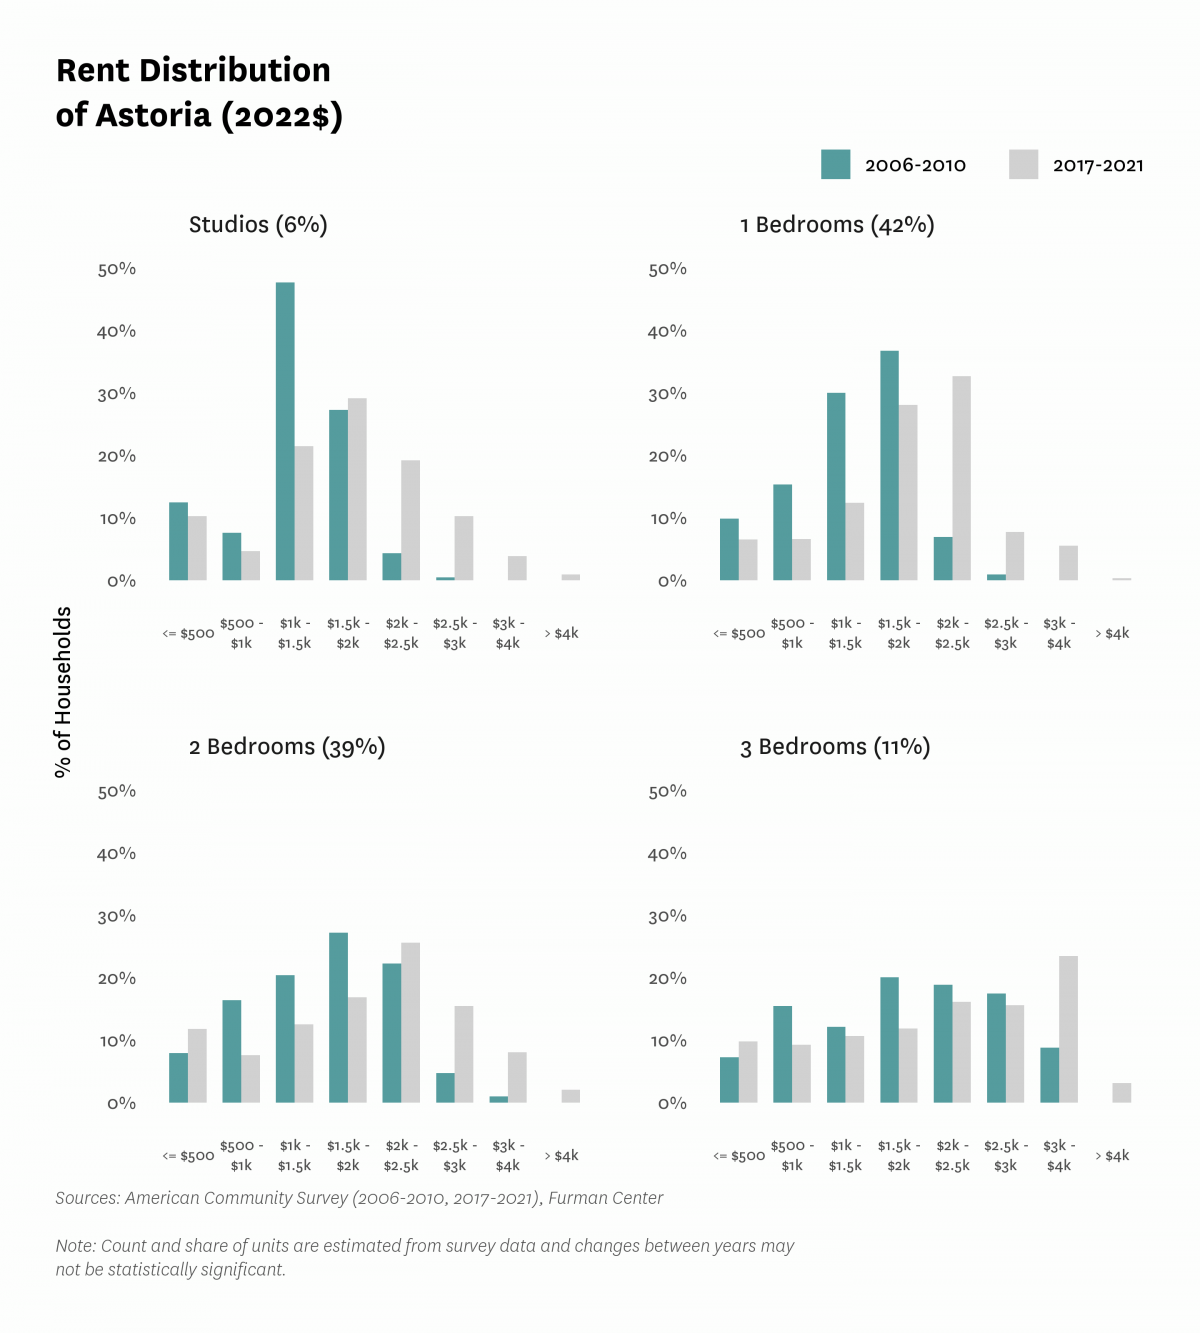
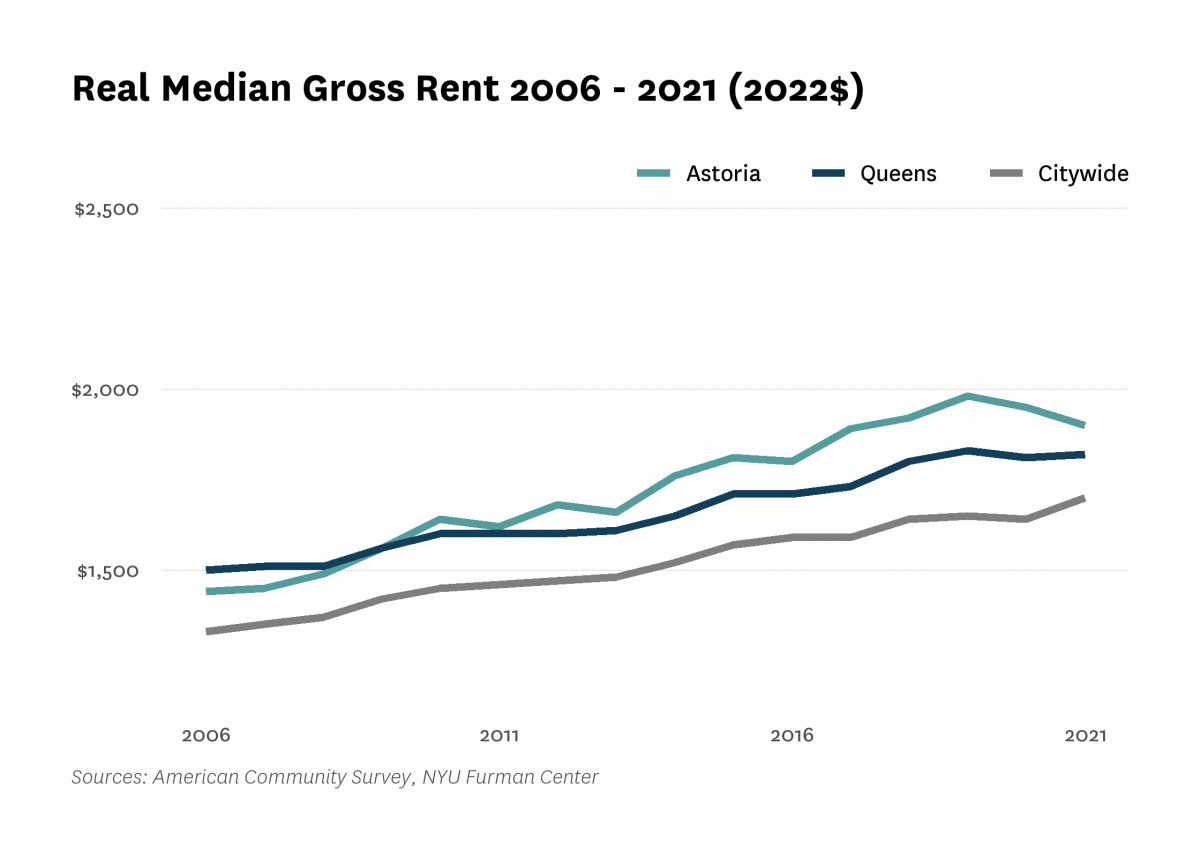
| Median rent, 2- and 3-bedrooms (2022$) | $1,700 | $1,940 | $2,100 | |||
| Median rent, all (2022$) | $1,270 | $1,440 | $1,640 | $1,980 | $1,900 | |
| Median rent, recent movers (2022$) | $1,830 | $2,200 | $2,290 | |||
| Median rent, studios and 1-bedrooms (2022$) | $1,410 | $1,770 | $1,930 | |||
| Change in collected rent (2019-2020) | -1.5% | |||||
| Affordability | ||||||
| Rental units affordable at 30% AMI (% of recently available units) | 2.6% | 3.0% | 4.2% | |||
| Rental units affordable at 80% AMI (% of recently available units) | 34.8% | 31.7% | 35.5% | |||
| Rental units affordable at 120% AMI (% of recently available units) | 94.1% | 90.4% | 89.6% | |||
| Rent Burden | ||||||
| Moderately rent-burdened households | 26.3% | 25.8% | 25.3% | 23.0% | ||
| Moderately rent-burdened households, low income | 34.6% | 34.5% | 35.1% | |||
| Moderately rent-burdened households, moderate income | 25.3% | 27.5% | 25.4% | |||
| Severely rent-burdened households | 20.7% | 23.0% | 21.7% | 19.8% | ||
| Severely rent-burdened households, low income | 40.6% | 40.9% | 38.8% | |||
| Severely rent-burdened households, moderate income | 0.8% | 0.3% | 0.4% | |||
| Rental Subsidy | ||||||
| Housing choice vouchers (% of occupied, privately owned rental units) | 0.8% | 0.4% | ||||
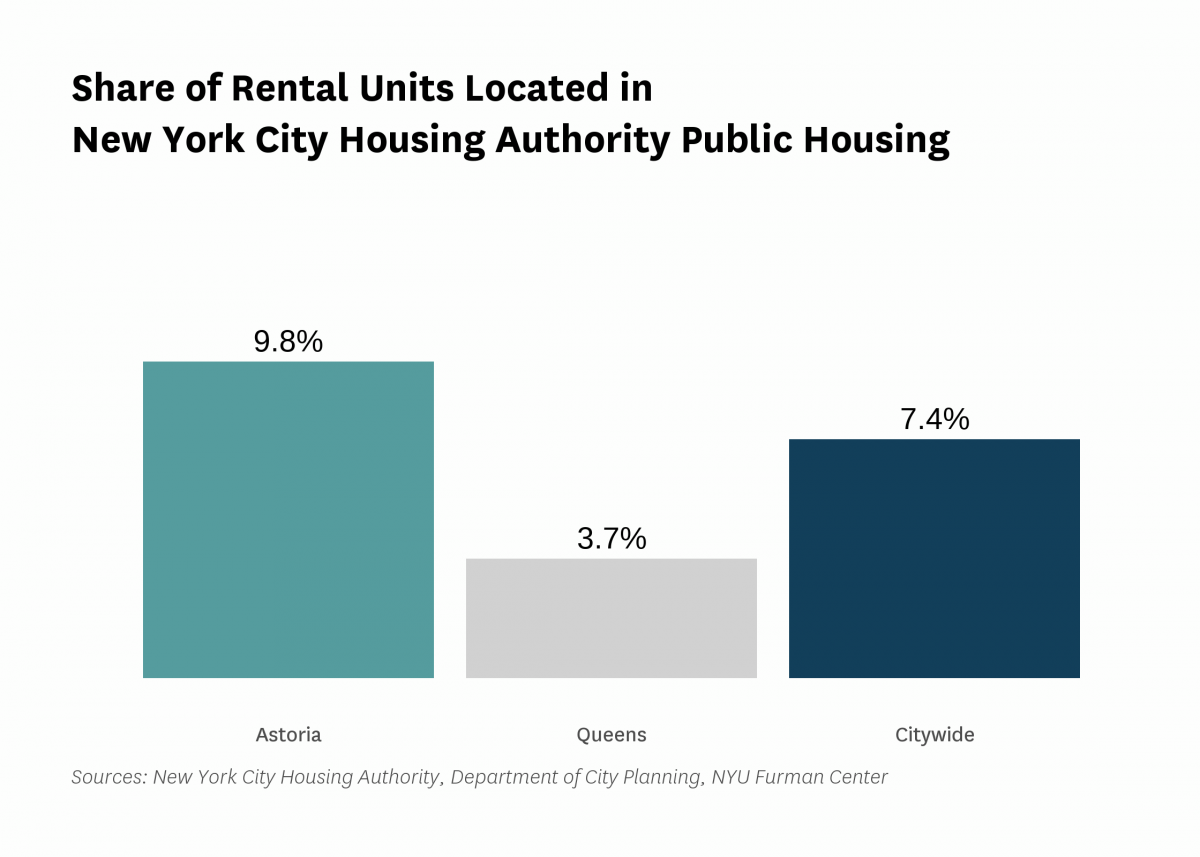
| Public housing (% of rental units) | 9.8% | |||||
Data Notes: See CoreData User Guide for more information about indicator definitions and methods.
Indicators: The rental vacancy rate, severe crowding rate, and the severely rent-burdened households indicators use five-year American Community Survey (ACS) estimates. Data under the 2010 heading comes from the 2006 – 2010 ACS, data under the 2019 heading comes from the 2015 – 2019 ACS and data under the 2021 heading comes from 2017 – 2021 ACS .
All content © 2005 – 2024 Furman Center for Real Estate and Urban Policy | Top of page | Contact Us