| Indicator | 2000 | 2006 | 2010 | 2019 | 2021 | 2022 |
|---|---|---|---|---|---|---|
| Population | ||||||
| Born in New York State | 54.8% | 53.3% | 52.2% | 54.2% | ||
| Disabled population | 4.9% | 5.2% | 8.2% | |||
| Foreign-born population | 37.3% | 39.2% | 41.4% | 42.0% | 38.9% | |
| Population | 194,836 | 204,600 | 202,929 | 196,895 | 196,219 | |
| Population aged 65+ | 11.2% | 10.8% | 11.1% | 16.2% | 19.1% | |
| Households | ||||||
| Households with children under 18 years old | 43.0% | 40.6% | 38.4% | 31.5% | 31.3% | |
| Single-person households | 21.3% | 21.8% | 23.8% | 25.9% | ||
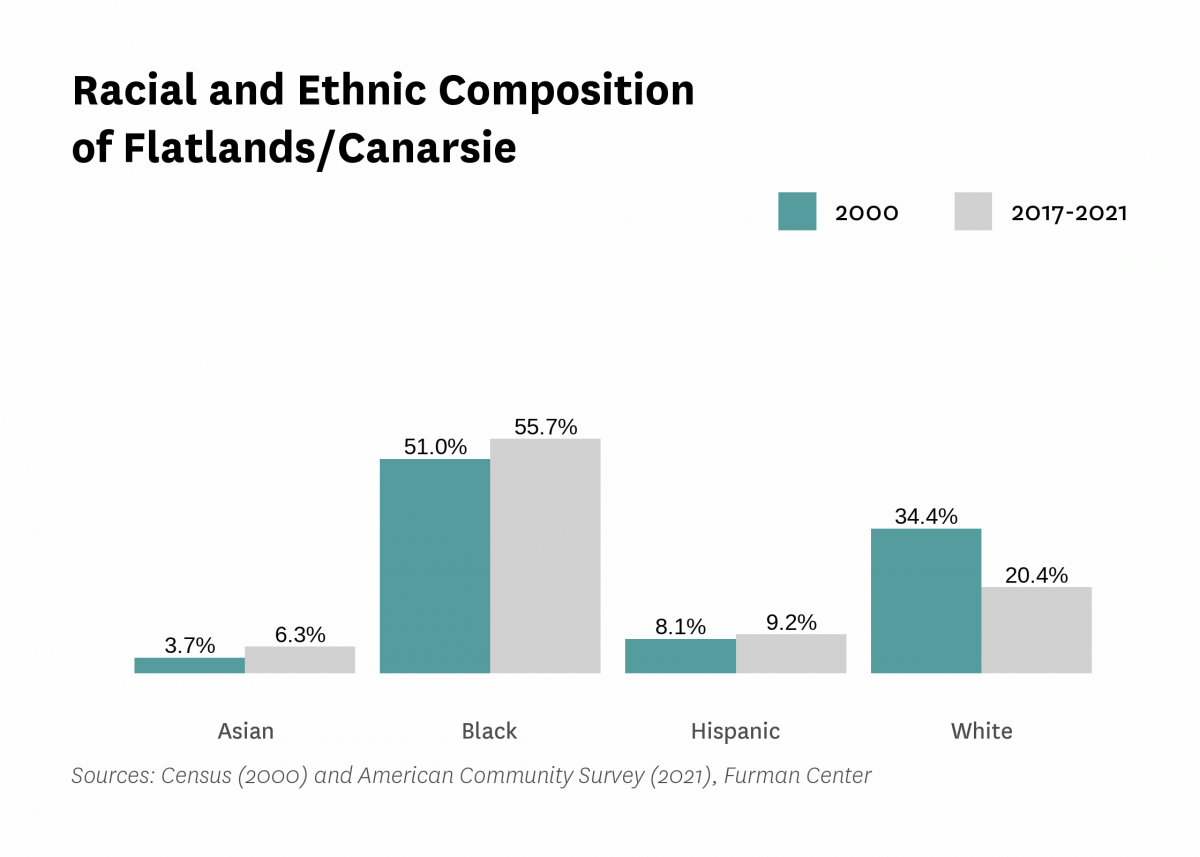
| Race and Ethnicity | ||||||
| Percent Asian | 3.7% | 3.0% | 3.7% | 5.4% | 6.3% | |
| Percent Black | 51.0% | 59.2% | 61.7% | 62.5% | 55.7% | |
| Percent Hispanic | 8.1% | 5.9% | 8.2% | 9.1% | 9.2% | |
| Percent white | 34.4% | 30.6% | 24.9% | 21.4% | 20.4% | |
| Racial diversity index | 0.61 | 0.55 | 0.55 | 0.55 | 0.64 | |
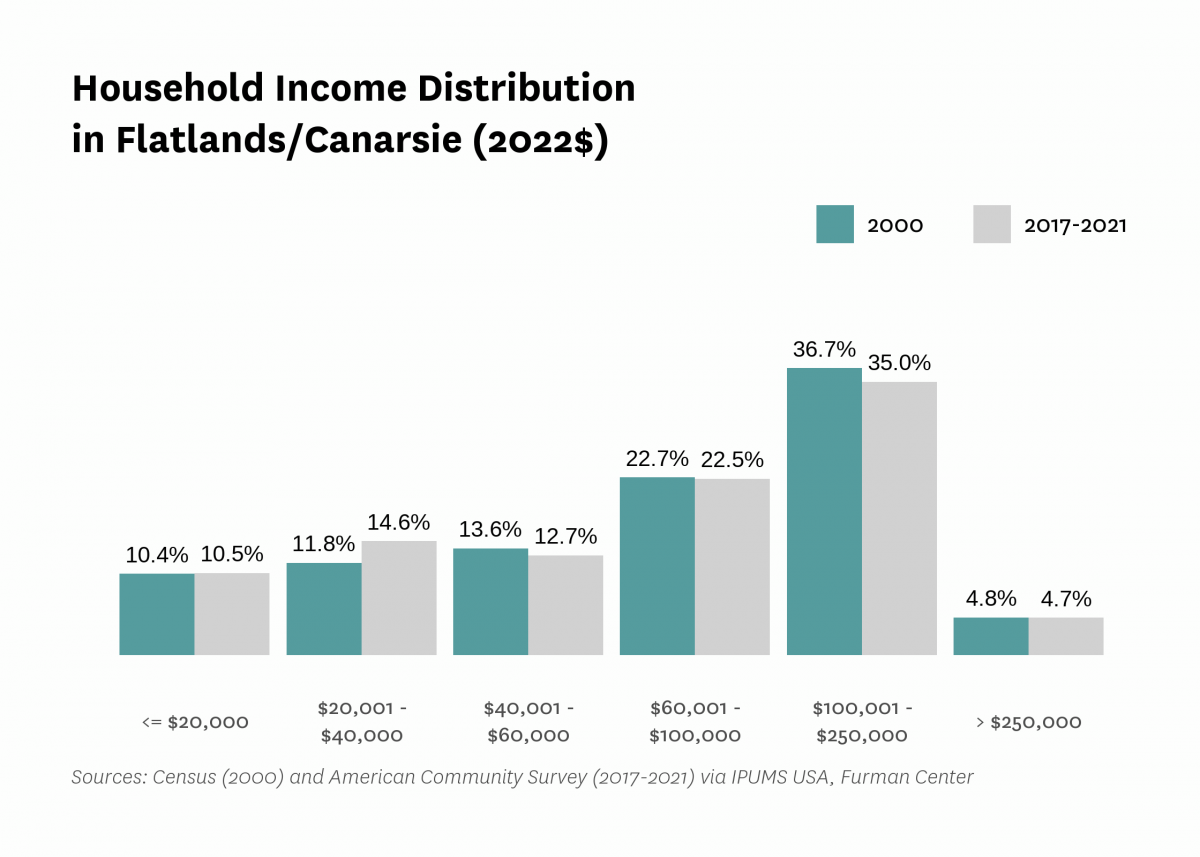
| Income and Poverty | ||||||
| Income diversity ratio | 3.5 | 4.0 | 4.3 | 4.6 | ||
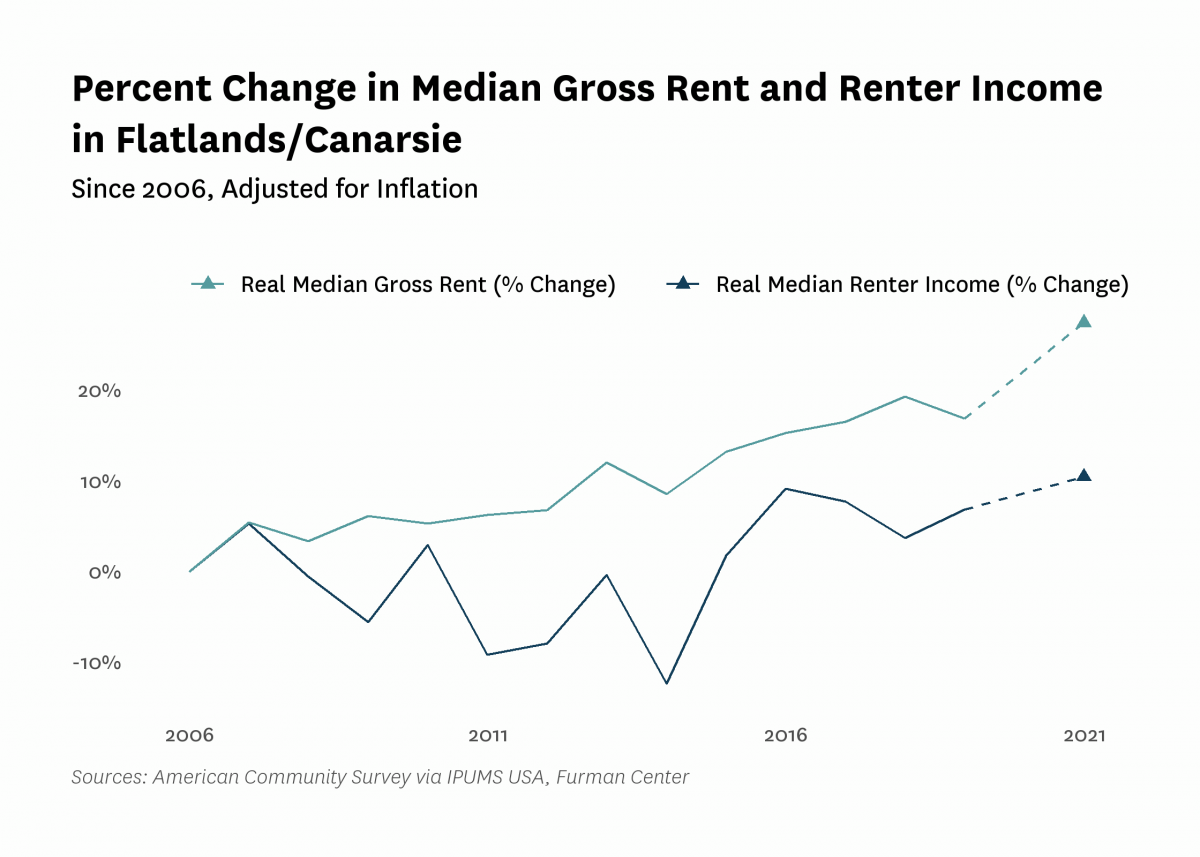
| Median household income (2022$) | $87,610 | $83,070 | $75,740 | $89,720 | $81,000 | |
| Median household income, homeowners (2022$) | $104,490 | $98,080 | $115,870 | $96,580 | ||
| Median household income, renters (2022$) | $53,800 | $55,400 | $57,480 | $59,430 | ||
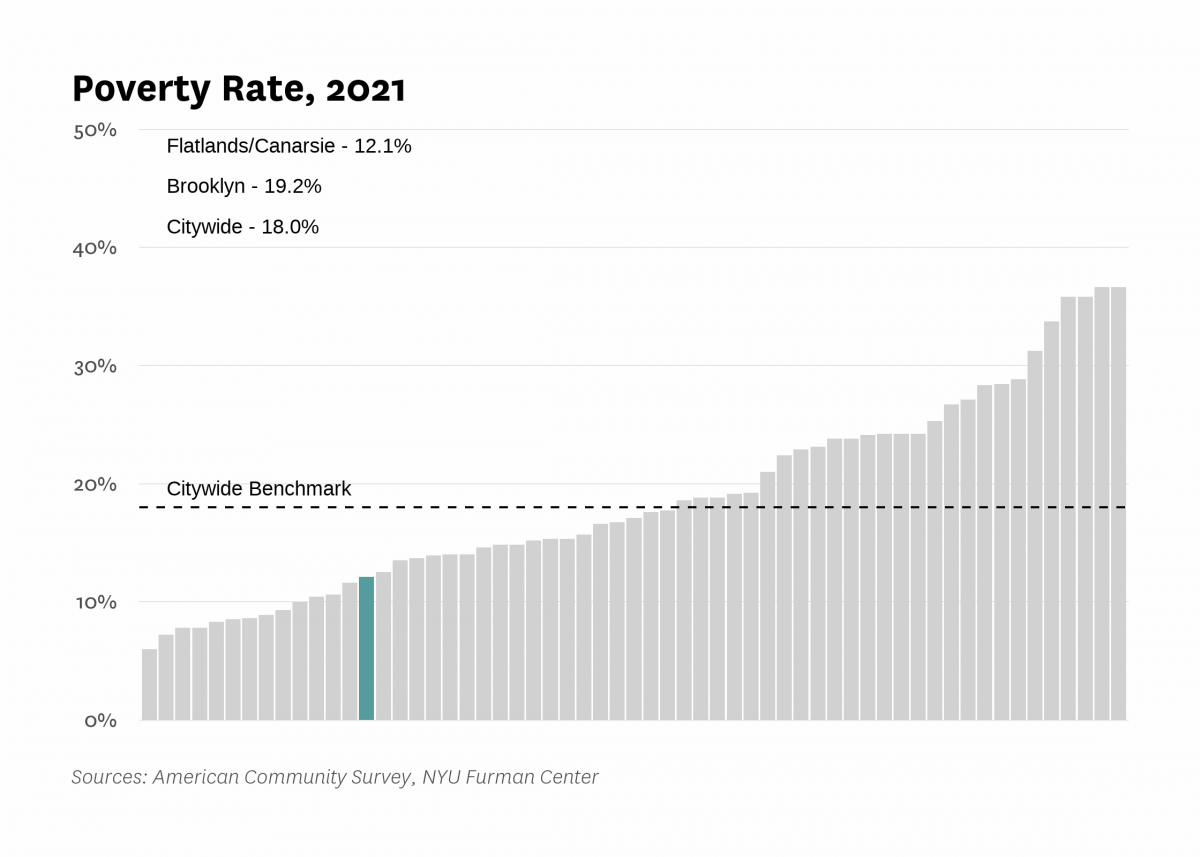
| Poverty rate | 12.2% | 10.8% | 11.4% | 10.6% | 12.1% | |
| Poverty rate, population aged 65+ | 13.3% | 14.3% | 12.4% | 9.3% | ||
| Poverty rate, population under 18 years old | 14.1% | 16.1% | 17.2% | 18.4% | ||
| Labor Market | ||||||
| Labor force participation rate | 61.5% | 65.0% | 62.6% | 59.2% | ||
| Population aged 25+ without a high school diploma | 13.2% | 12.6% | 12.1% | 11.1% | ||
| Unemployment rate | 7.96% | 5.52% | 8.29% | 3.23% | 10.16% | |
| Indicator | 2000 | 2006 | 2010 | 2019 | 2021 | 2022 |
|---|---|---|---|---|---|---|
| Housing Stock | ||||||
| Homeownership rate | 54.7% | 62.4% | 57.8% | 58.3% | 58.9% | |
| Housing units | 69,777 | 71,757 | 77,372 | 72,901 | ||
| Rental vacancy rate | 3.4% | 2.3% | 2.4% | |||
| Serious housing code violations (per 1,000 privately owned rental units) | 18.0 | 37.8 | 63.2 | 54.3 | 57.3 | |
| Severe crowding rate (% of renter households) | 2.4% | 3.9% | 3.7% | |||
| Total housing code violations (per 1,000 privately owned rental units) | 101.7 | 160.3 | 239.9 | 245.0 | 255.3 | |
| Finance - Distress | ||||||
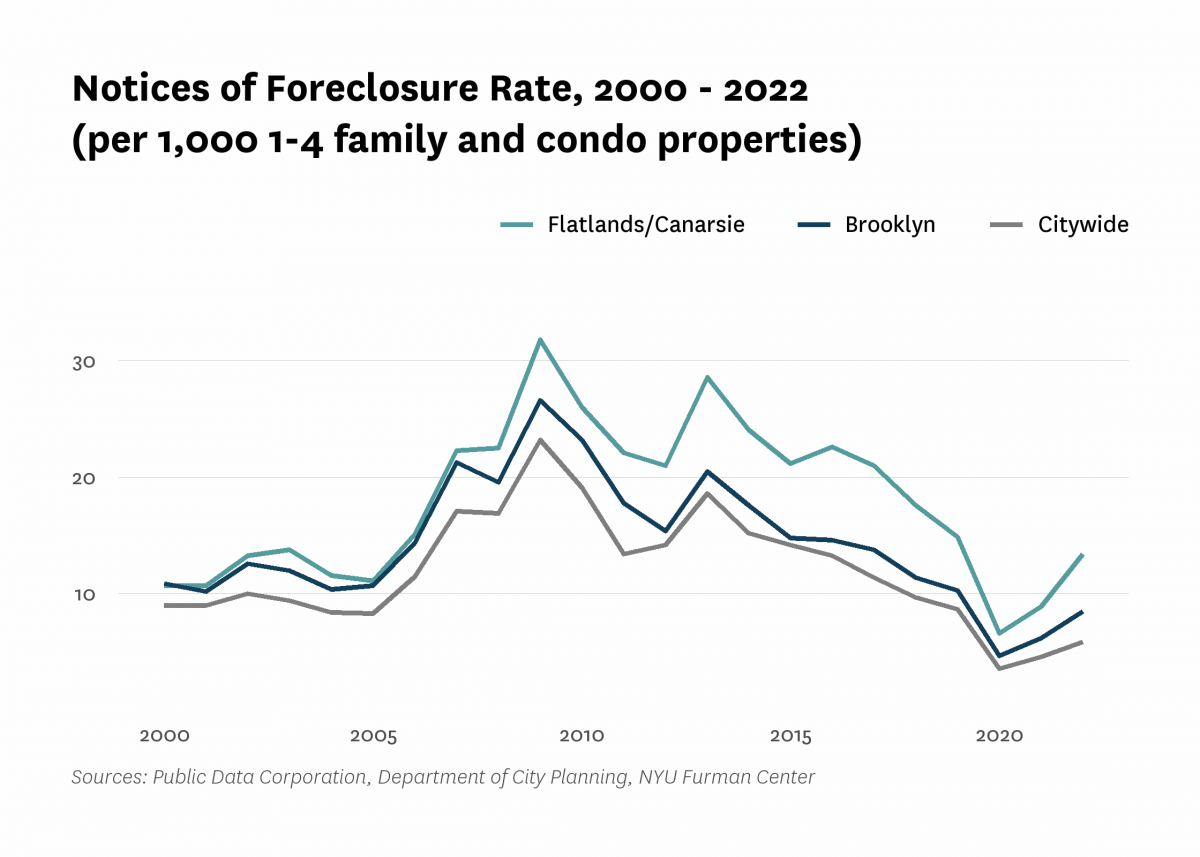
| Notices of foreclosure rate (per 1,000 1-4 family and condo properties) | 10.7 | 15.1 | 26.0 | 14.9 | 8.9 | 13.4 |
| Notices of foreclosure, all residential properties | 364 | 521 | 909 | 513 | 315 | 466 |
| Notices of foreclosure, initial, 1-4 family and condo properties | 264 | 420 | 596 | 197 | 77 | 168 |
| Notices of foreclosure, repeat, 1-4 family and condo properties | 92 | 96 | 297 | 315 | 231 | 294 |
| Pre-foreclosure notice rate (per 1,000 1-4 family and condo properties) | 88.7 | 30.8 | 76.7 | |||
| Pre-foreclosure notices, 1-4 family and condo properties | 3,053 | 1,061 | 2,644 | |||
| Properties entering REO, 1-4 family | 51 | 6 | 22 | |||
| Finance - Lending | ||||||
| FHA/VA-backed home purchase loans (% of home purchase loans) | 0.6% | 48.5% | 26.7% | 22.8% | ||
| Higher-cost home purchase loans (% of home purchase loans) | 39.4% | 1.3% | 15.2% | 5.8% | ||
| Higher-cost refinance loans (% of refinance loans) | 38.8% | 2.9% | 3.9% | 1.2% | ||
| Home purchase loan rate (per 1,000 properties) | 47.6 | 16.8 | 22.7 | 27.9 | ||
| Home purchase loans in LMI tracts (% of home purchase loans) | 0.8% | 5.6% | 0.0% | 0.1% | ||
| Home purchase loans to LMI borrowers (% of home purchase loans) | 2.9% | 1.0% | 7.3% | 7.5% | ||
| Refinance loan rate (per 1,000 properties) | 91.9 | 21.8 | 28.7 | 58.5 | ||
| Sales - Volume | ||||||
| Sales volume, 1 family building | 808 | 750 | 311 | 301 | 325 | 457 |
| Sales volume, 2-4 family building | 911 | 972 | 303 | 313 | 246 | 420 |
| Sales volume, 5+ family building | 2 | 3 | 1 | 4 | 0 | 1 |
| Sales volume, condominium | 71 | 74 | 63 | 64 | 63 | 56 |
| Sales volume, all property types | 1,792 | 1,799 | 678 | 682 | 634 | 934 |
| Sales - Median Prices | ||||||
| Median sales price per unit, 1 family building (2022$) | $373,870 | $634,120 | $544,660 | $685,700 | $742,720 | $730,000 |
| Median sales price per unit, 2-4 family building (2022$) | $215,480 | $386,450 | $305,810 | $381,870 | $440,330 | $406,000 |
| Median sales price per unit, 5+ family building (2022$) | $64,490 | $120,190 | $130,770 | $239,330 | $207,080 | |
| Median sales price per unit, condominium (2022$) | $249,810 | $439,140 | $463,540 | $445,980 | $450,940 | $440,000 |
| Sales - Housing Price Index | ||||||
| Index of housing price appreciation, 1 family building | 100.0 | 207.7 | 188.0 | 251.1 | 297.4 | 304.0 |
| Index of housing price appreciation, 2-4 family building | 100.0 | 216.5 | 170.3 | 236.4 | 292.7 | 280.8 |
| Index of housing price appreciation, 5+ family building | 100.0 | 303.5 | 433.7 | 817.7 | 369.9 | |
| Index of housing price appreciation, condominium | 100.0 | 207.6 | 133.7 | 228.1 | 238.9 | 235.1 |
| Index of housing price appreciation, all property types | 100.0 | 213.7 | 177.2 | 244.2 | 291.6 | 291.1 |
| Subsidized Housing | ||||||
| Total number of subsidized properties (properties) | 16 | |||||
| HUD Financing or Insurance (properties) | 1 | |||||
| HUD Financing or Insurance (units) | 40 | |||||
| HUD Project-based Rental Assistance Program (properties) | 1 | |||||
| HUD Project-based Rental Assistance Program (units) | 0 | |||||
| Low Income Housing Tax Credit (properties) | 2 | |||||
| Low Income Housing Tax Credit (units) | 1,820 | |||||
| Public Housing (properties) | 7 | |||||
| Public Housing (units) | 4,418 | |||||
| Mitchell-Lama (properties) | 0 | |||||
| Mitchell-Lama (units) | 0 | |||||
| 421-a Tax Exemption (properties) | 16 | |||||
| 421-a Tax Exemption (units) | 570 | |||||
| 420-c Tax Exemption (properties) | 0 | |||||
| 420-c Tax Exemption (units) | 0 | |||||
| NYC Housing Production Programs and Zoning Incentives or Requirements (properties) | 5 | |||||
| Eligible to expire from housing programs between 2023 and 2028 (properties) | 1 | |||||
| Eligible to expire from housing programs between 2023 and 2028 (units) | 210 | |||||
| Eligible to expire from housing programs between 2029 and 2038 (properties) | 0 | |||||
| Eligible to expire from housing programs between 2029 and 2038 (units) | 0 | |||||
| Eligible to expire from housing programs in 2039 and later (properties) | 3 | |||||
| Eligible to expire from housing programs in 2039 and later (units) | 1,650 | |||||
| Indicator | 2000 | 2006 | 2010 | 2019 | 2021 | 2022 |
|---|---|---|---|---|---|---|
| Density | ||||||
| Population density (1,000 persons per square mile) | 16.7 | 16.6 | 16.1 | 16.0 | ||
| Development | ||||||
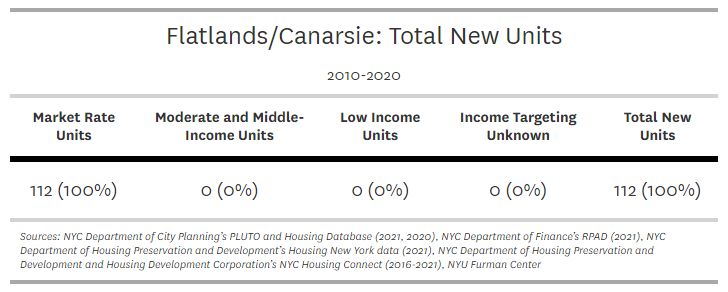
| Units authorized by new residential building permits | 129 | 0 | 21 | 24 | 81 | 11 |
| Units issued new certificates of occupancy | 134 | 238 | 54 | 25 | 30 | 4 |
| Indicator | 2000 | 2006 | 2010 | 2019 | 2021 | 2022 |
|---|---|---|---|---|---|---|
| Commute | ||||||
| Car-free commute (% of commuters) | 46.6% | 52.4% | 50.2% | 52.1% | 47.3% | |
| Mean travel time to work (minutes) | 46.7 | 43.9 | 41.3 | 52.2 | 45.8 | |
| Crime and Incarceration | ||||||
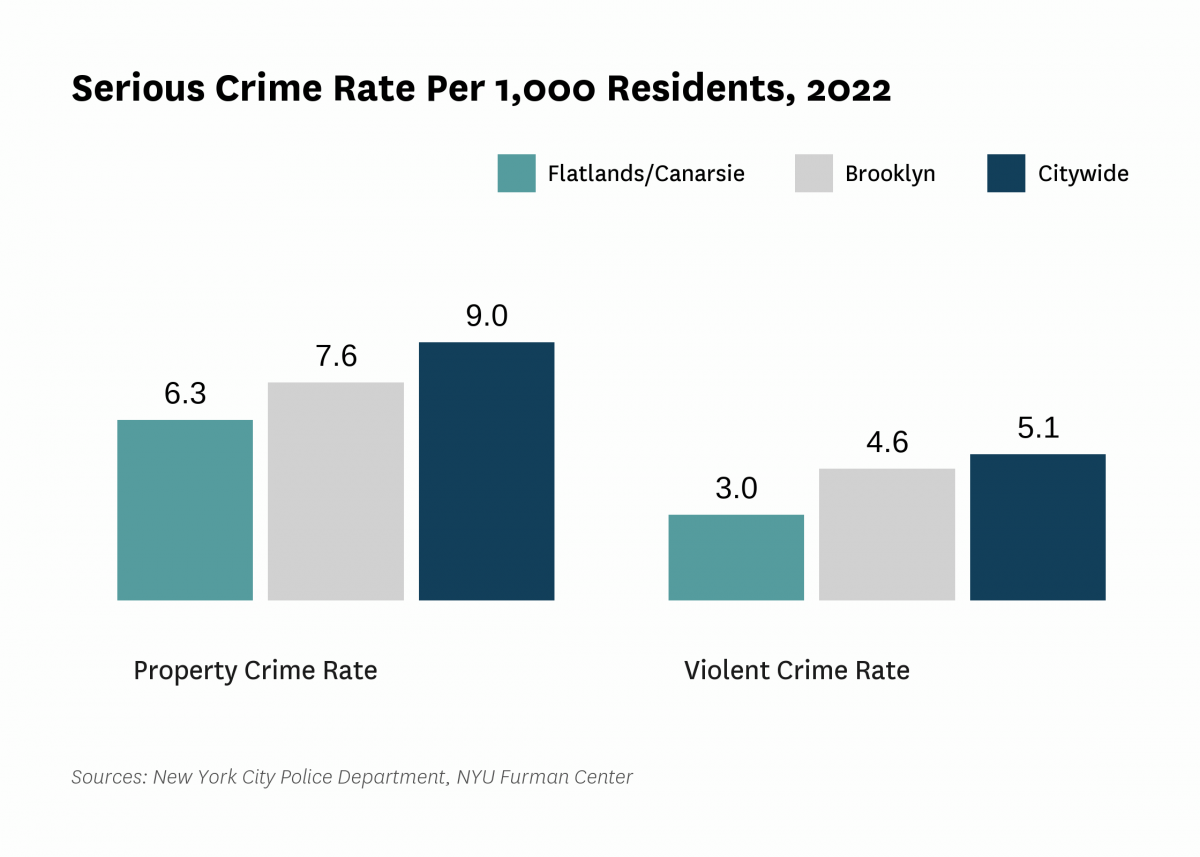
| Serious crime rate (per 1,000 residents) | 15.2 | 12.2 | 7.9 | 7.3 | 9.2 | |
| Serious crime rate, property (per 1,000 residents) | 10.6 | 8.2 | 5.5 | 4.7 | 6.3 | |
| Serious crime rate, violent (per 1,000 residents) | 4.6 | 3.9 | 2.4 | 2.6 | 3.0 | |
| Schools | ||||||
| Students performing at grade level in English language arts, 4th grade | 49.7% | 47.0% | ||||
| Students performing at grade level in math, 4th grade | 49.4% | 49.9% | ||||
| Indicator | 2000 | 2006 | 2010 | 2019 | 2021 | 2022 |
|---|---|---|---|---|---|---|
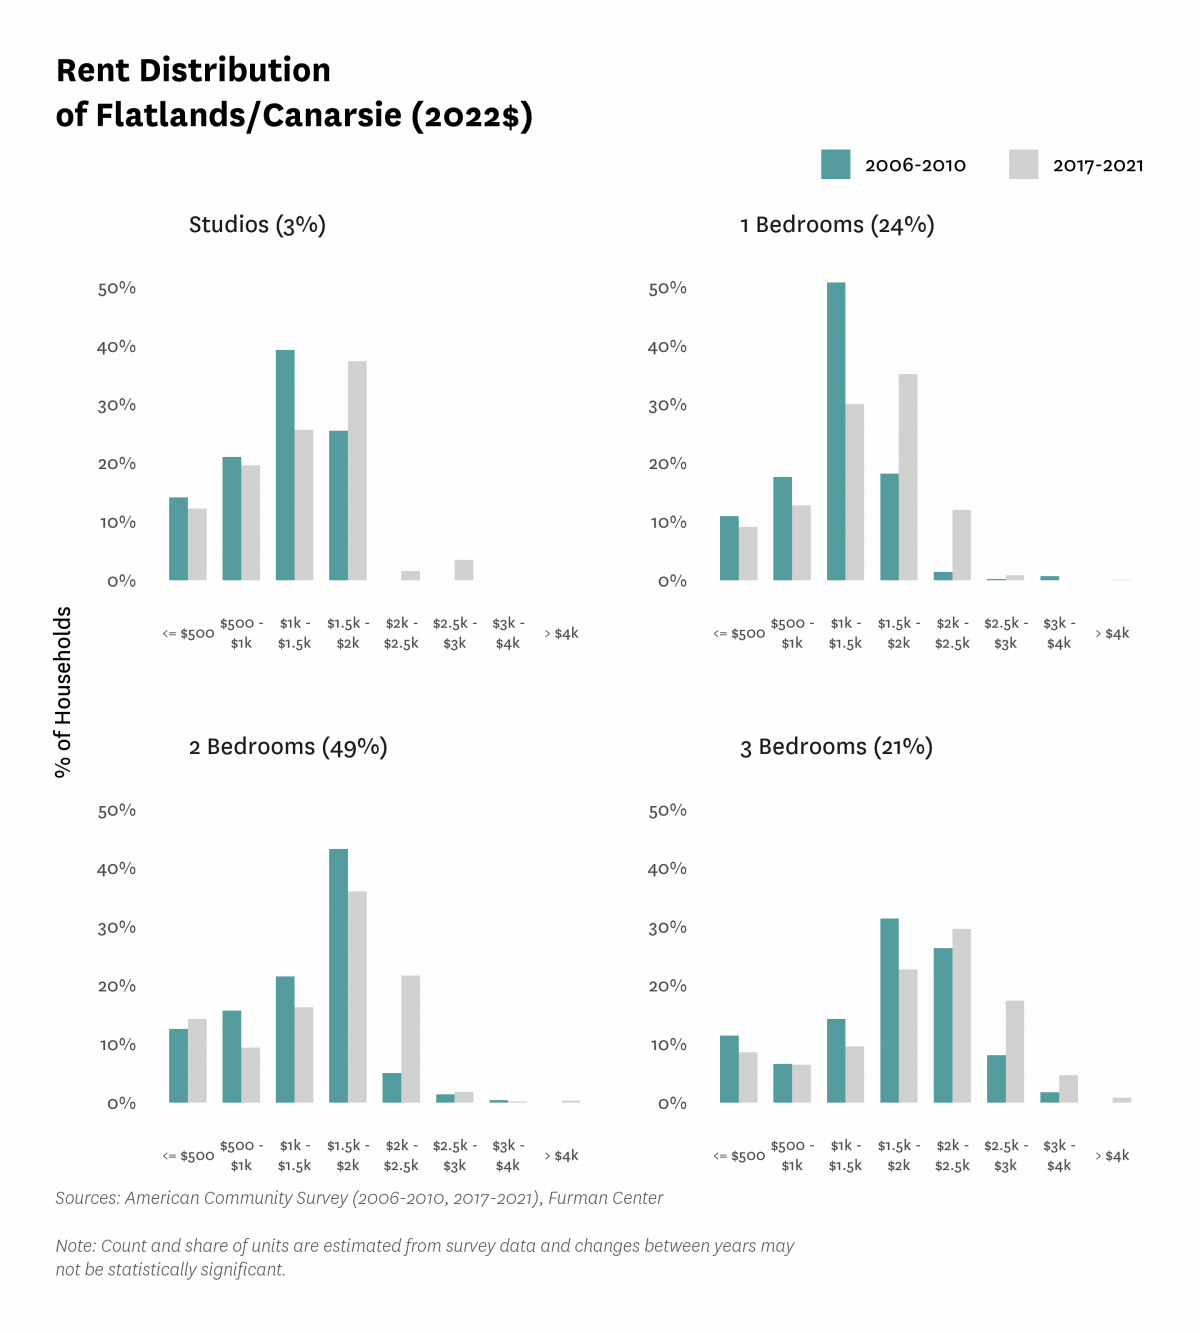
| Median Rent | ||||||
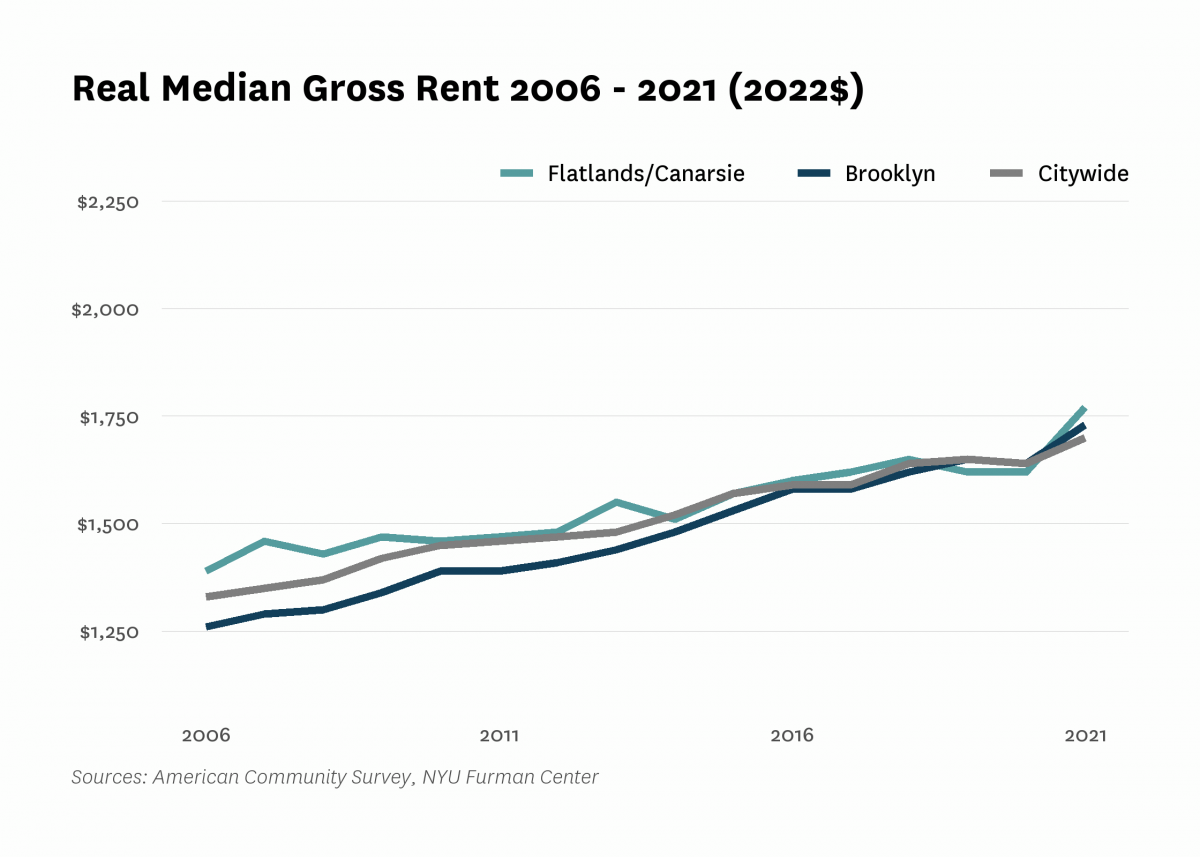
| Median rent, 2- and 3-bedrooms (2022$) | $1,600 | $1,670 | $1,790 | |||
| Median rent, all (2022$) | $1,330 | $1,390 | $1,460 | $1,620 | $1,770 | |
| Median rent, recent movers (2022$) | $1,700 | $1,880 | $1,900 | |||
| Median rent, studios and 1-bedrooms (2022$) | $1,230 | $1,330 | $1,490 | |||
| Change in collected rent (2019-2020) | 2.2% | |||||
| Affordability | ||||||
| Rental units affordable at 30% AMI (% of recently available units) | 2.9% | 4.8% | 9.0% | |||
| Rental units affordable at 80% AMI (% of recently available units) | 60.5% | 73.9% | 77.8% | |||
| Rental units affordable at 120% AMI (% of recently available units) | 98.2% | 98.3% | 98.7% | |||
| Rent Burden | ||||||
| Moderately rent-burdened households | 25.4% | 23.7% | 25.7% | 24.1% | ||
| Moderately rent-burdened households, low income | 29.5% | 33.3% | 35.5% | |||
| Moderately rent-burdened households, moderate income | 13.3% | 6.5% | 7.2% | |||
| Severely rent-burdened households | 22.9% | 24.3% | 25.9% | 25.2% | ||
| Severely rent-burdened households, low income | 39.6% | 40.0% | 38.9% | |||
| Severely rent-burdened households, moderate income | 0.9% | 0.0% | 0.0% | |||
| Rental Subsidy | ||||||
| Housing choice vouchers (% of occupied, privately owned rental units) | 4.4% | 2.4% | ||||
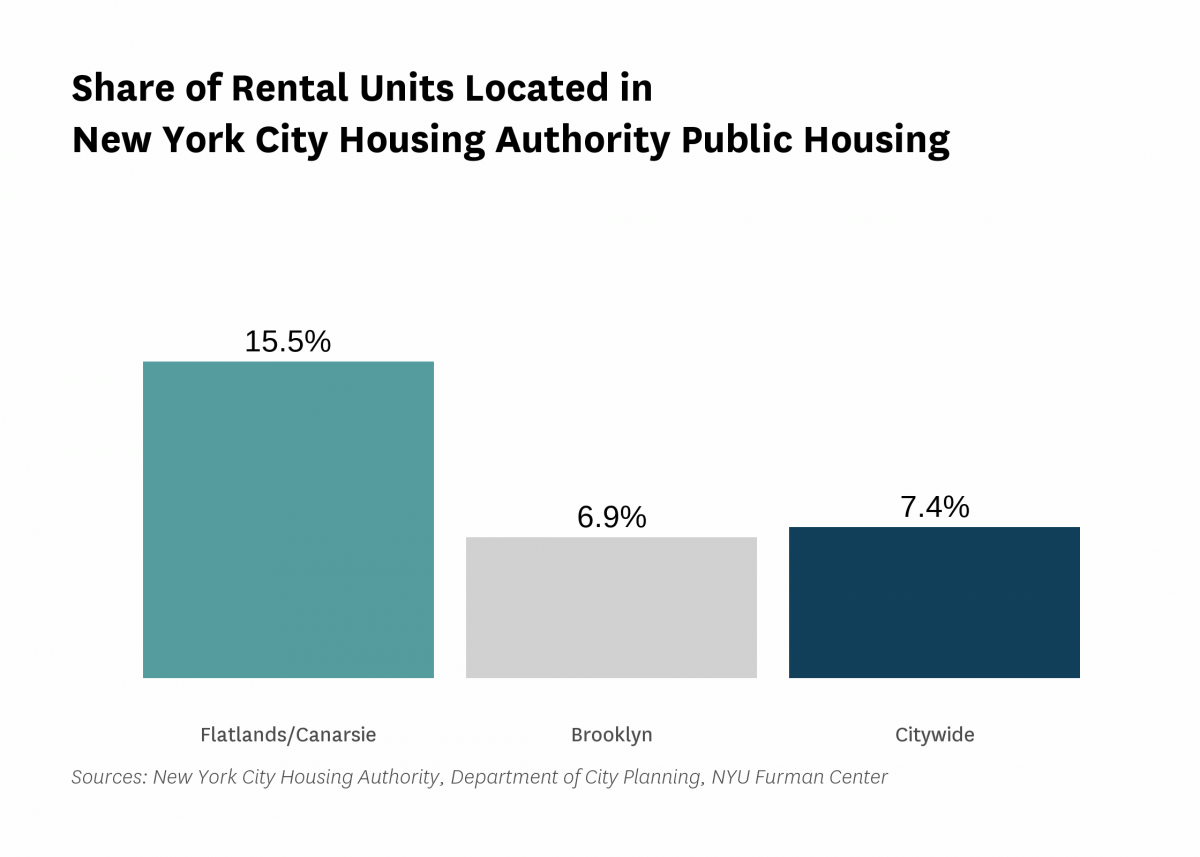
| Public housing (% of rental units) | 15.5% | |||||

Data Notes: See CoreData User Guide for more information about indicator definitions and methods.
Indicators: The rental vacancy rate, severe crowding rate, and the severely rent-burdened households indicators use five-year American Community Survey (ACS) estimates. Data under the 2010 heading comes from the 2006 – 2010 ACS, data under the 2019 heading comes from the 2015 – 2019 ACS and data under the 2021 heading comes from 2017 – 2021 ACS .
All content © 2005 – 2024 Furman Center for Real Estate and Urban Policy | Top of page | Contact Us