Snapshot of Homeownership in New York City

The recent release of 2018 Home Mortgage Disclosure Act (HMDA) data provides an opportunity to assess the most current public information on homeownership trends, purchase originations, and refinance originations in New York City. Below we share insights about homeownership patterns in New York City, drawing on the recently released HMDA data together with 2018 American Community Survey and up-to-date foreclosure data.
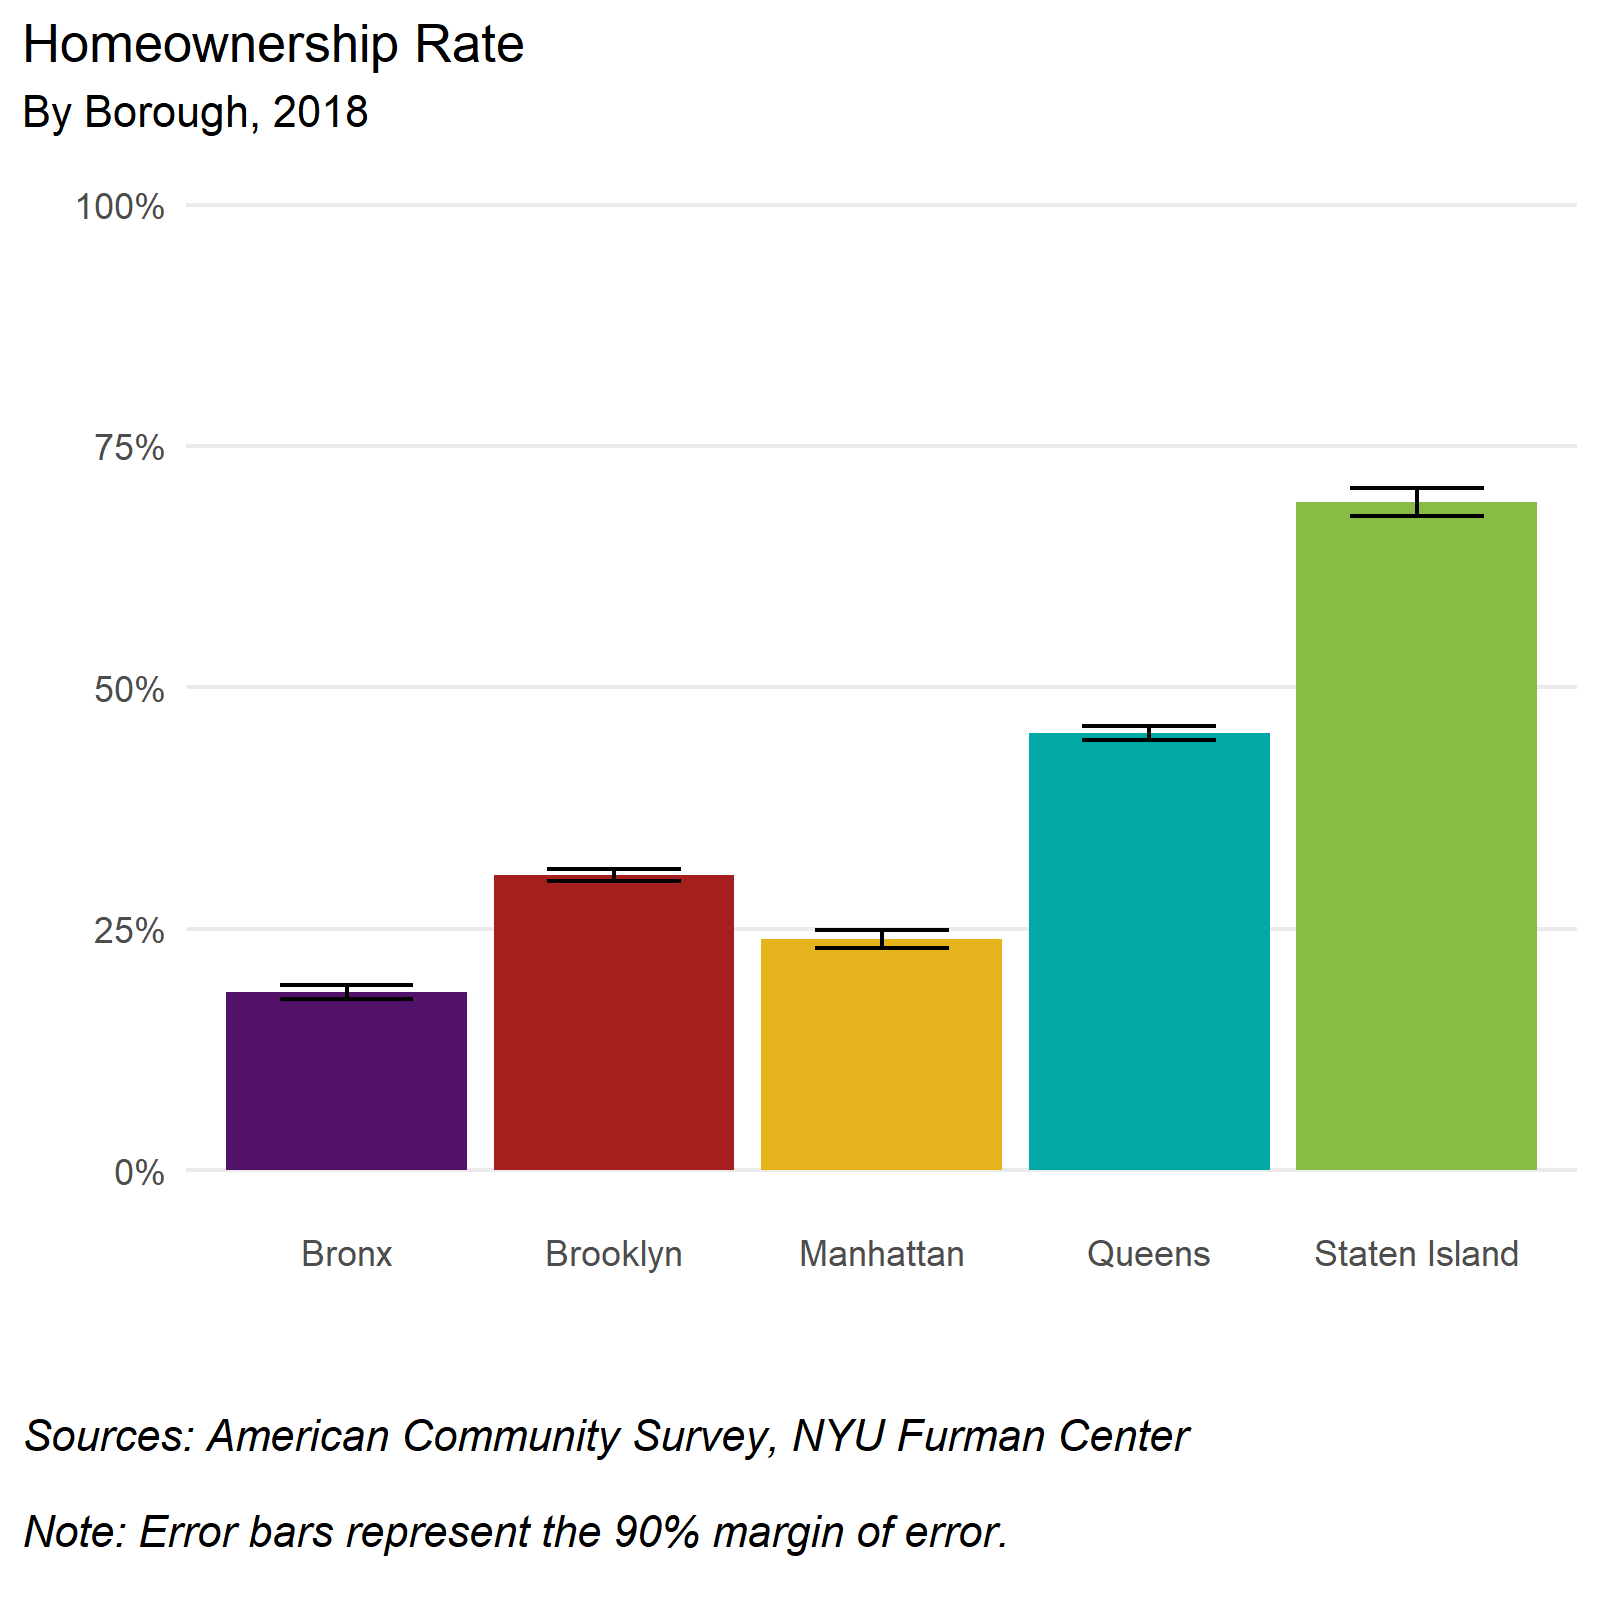
Homeownership rate continues to vary by geography and race
In 2018, the New York City homeownership rate was 33 percent, but it varied by borough. The homeownership rate in Staten Island was 69 percent, far closer to the national rate (64%) than any other borough. The Bronx had the lowest homeownership rate at 18 percent, approximately 45 percentage points lower than the national rate. Queens had a homeownership rate of 45 percent, Brooklyn 30 percent, and Manhattan 24 percent.
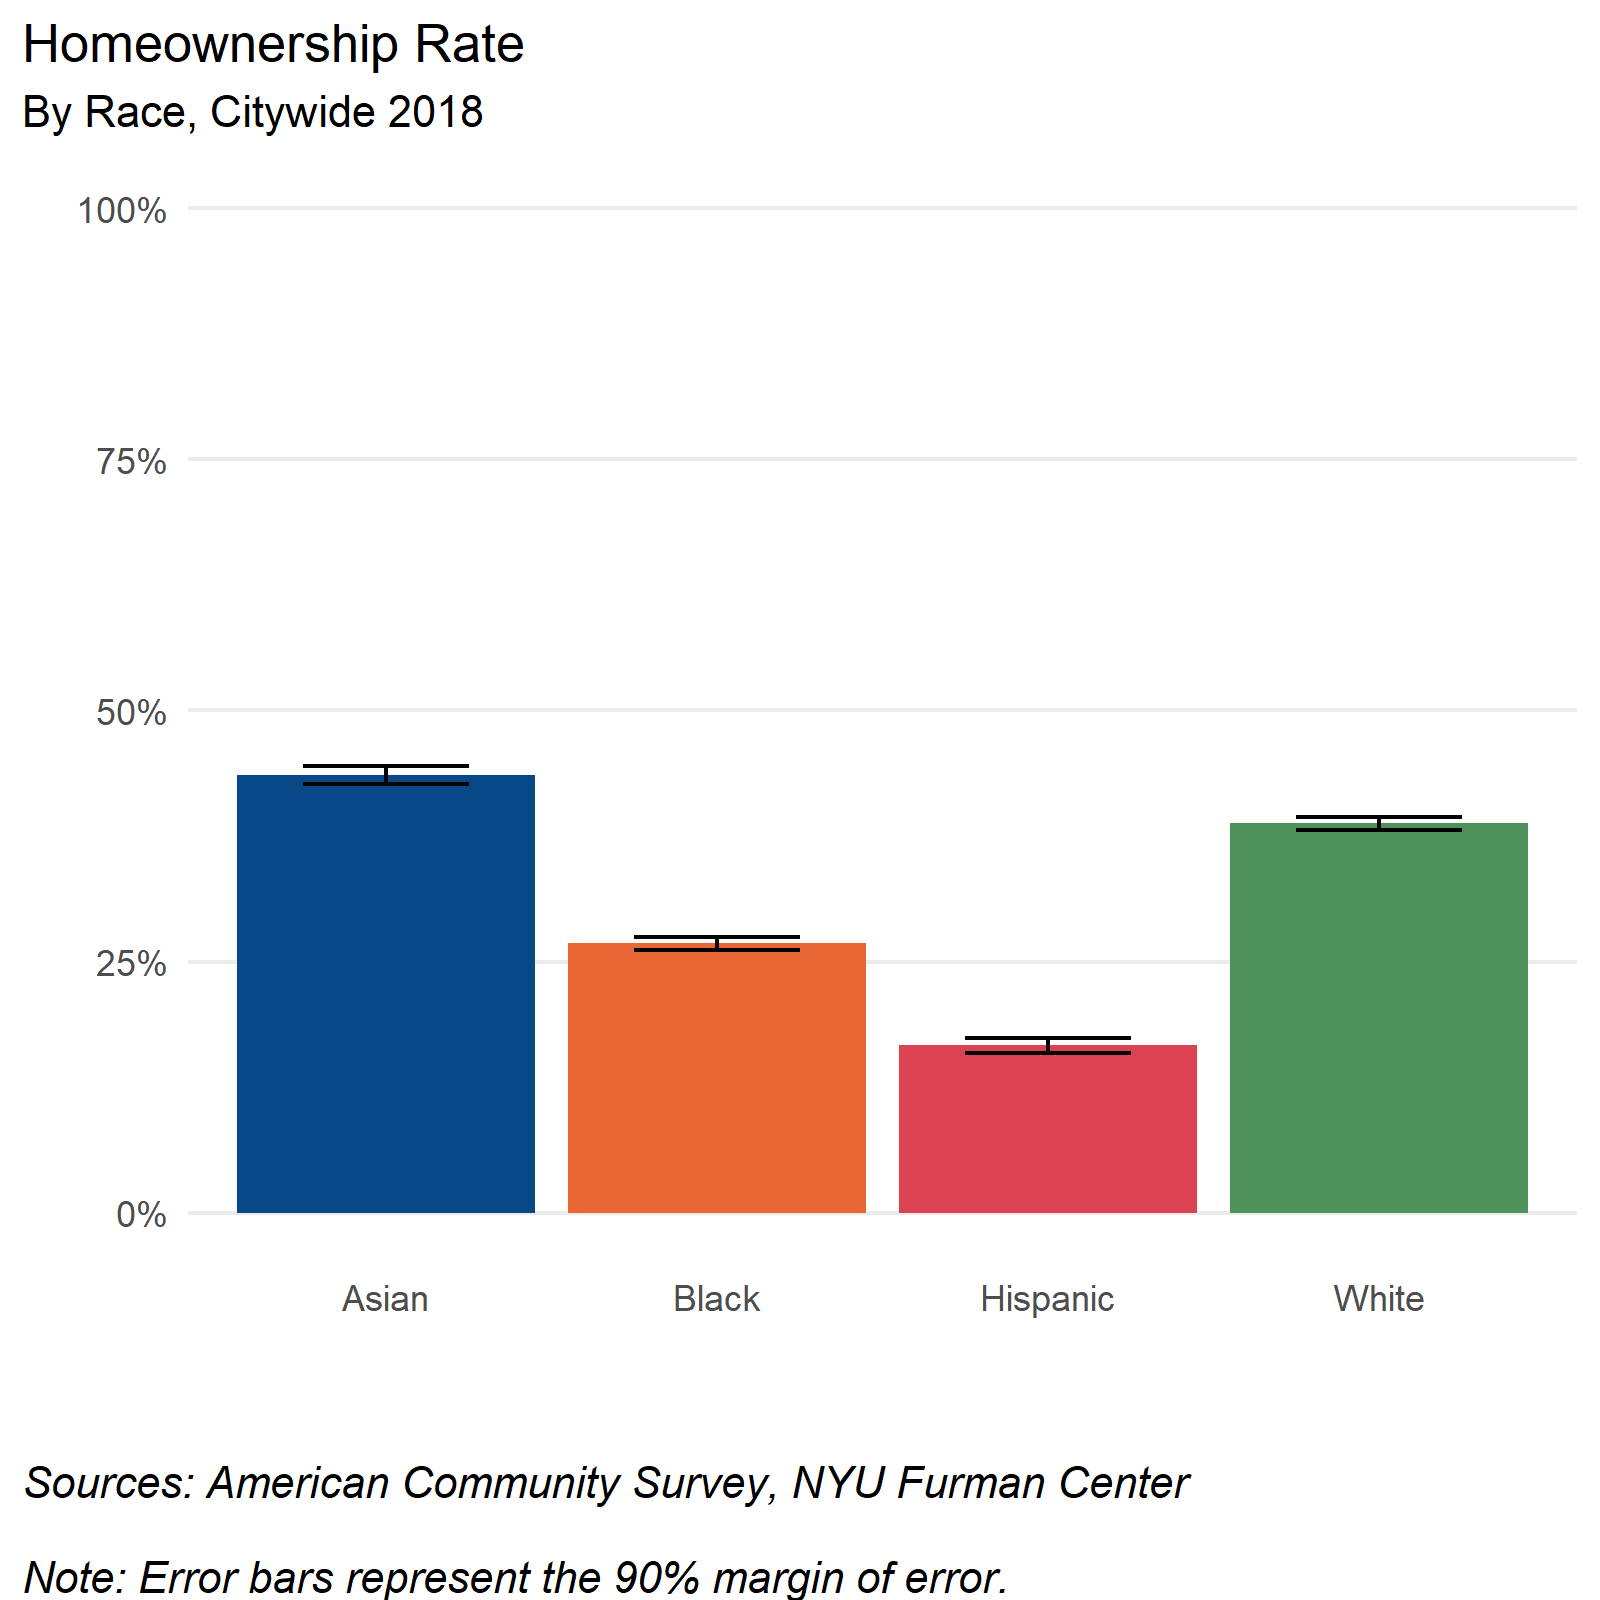
Homeownership rates also vary across racial lines. While 44 percent of Asian households and 43 percent of white households own their homes, only 27 percent and 17 percent of Black and Hispanic households own their homes, respectively.
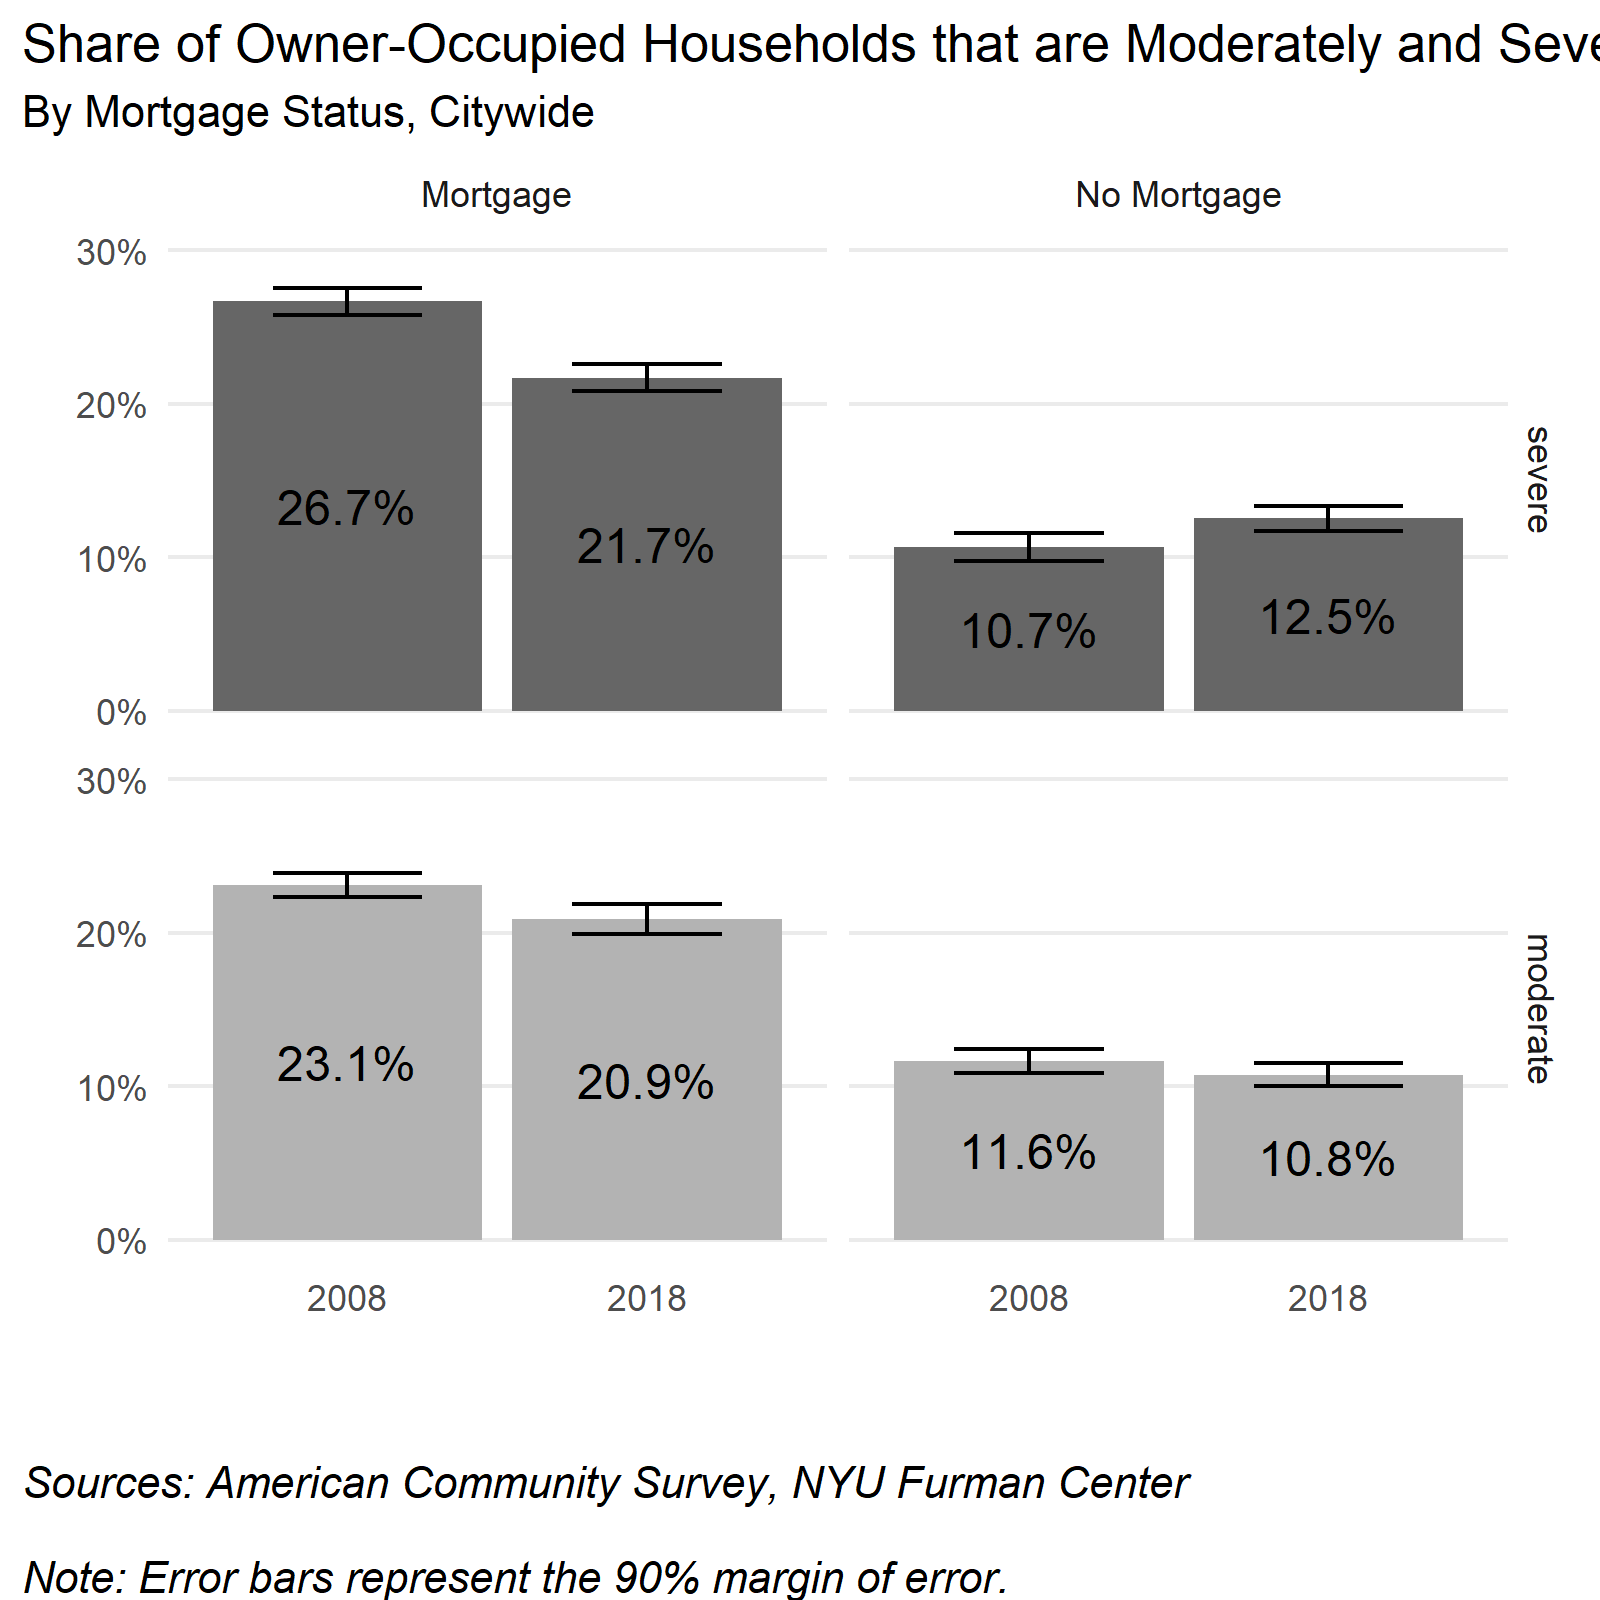
Cost burden is not limited to renter households: Over 40 percent of New York City homeowners with mortgages were cost burdened
The United States Department of Housing and Urban Development (HUD) defines moderate home cost burden as a household spending 30 percent or more of their income on housing costs, and severe home cost burden as a household spending 50 percent or more of their income on housing costs. While households with mortgages were more likely to be cost burdened than those without mortgages, about one in five households without mortgages are either moderately or severely cost burdened. Notably, about half of cost burdened homeowner households were severely cost burdened.
Ten years after the foreclosure crisis, the share of severely cost burdened owner-occupied households with mortgages declined to about 22 percent in 2018 (from 27 percent in 2008). Several factors could have driven this decline. One possibility is that the foreclosure crisis pushed many owners out of the homeownership market entirely, leaving a remaining pool who were less cost burdened. Another factor could be that post-crisis lending patterns, such as smaller loan amounts, tighter credit, and relatively low interest rates, have together gradually increased the share of borrowers with lower monthly payments relative to incomes.
In contrast, the share of severely cost-burdened households without a mortgage grew from 10.7 percent in 2008 to 12.5 percent in 2018. It is important to note that many of these homeowners have gained equity through the appreciation of home values, and that at least some may have other assets or retirement savings available. Yet for others, increases in other costs of owning one’s home may represent real financial hardship, possibly limiting the choice for cost-burdened homeowners to maintain ownership of their home. There was no statistically significant change in the share of moderately cost burdened households without mortgages.
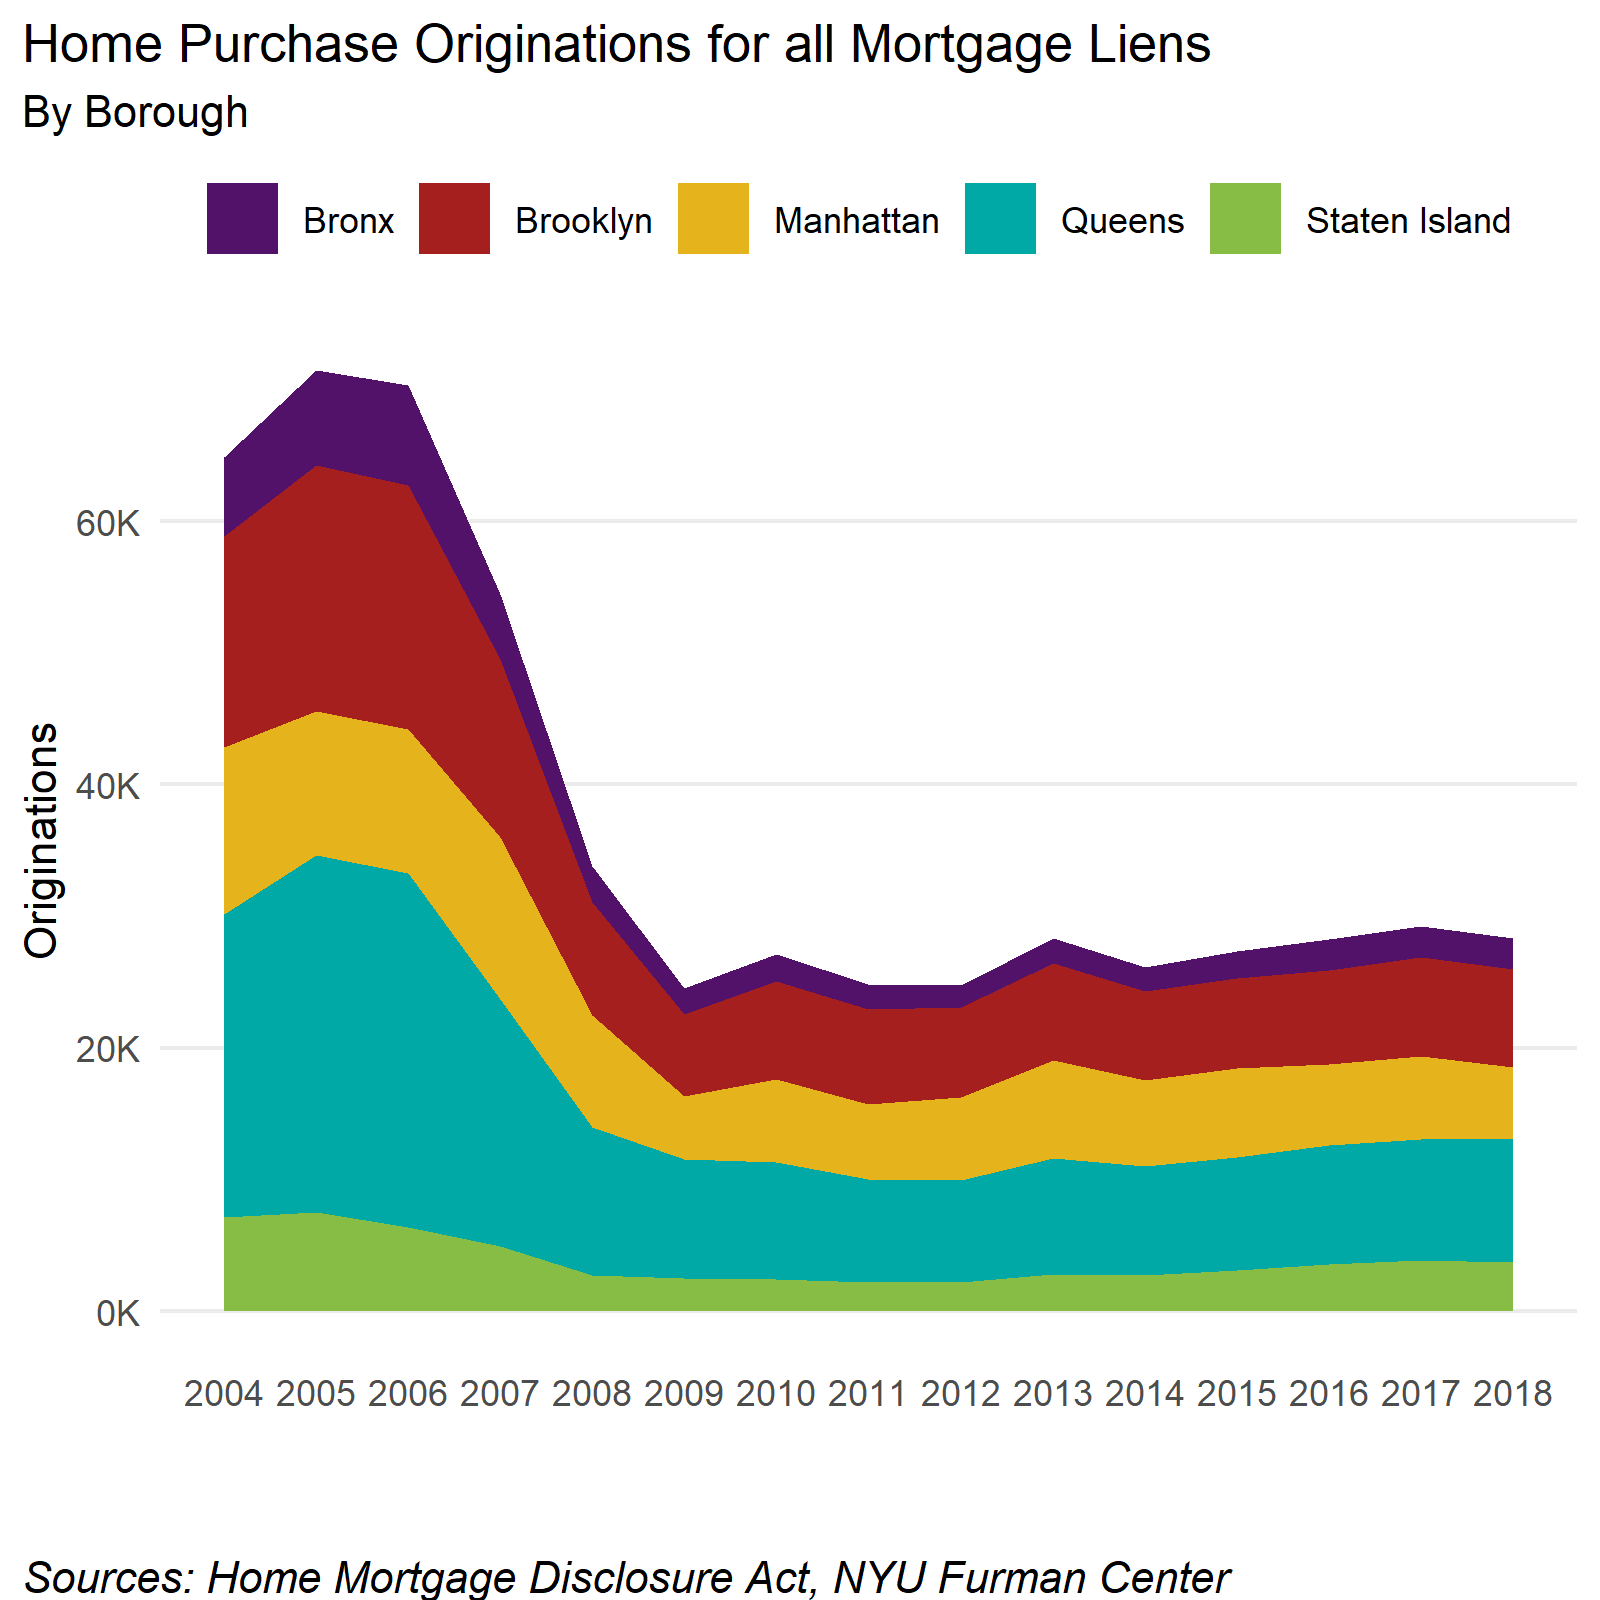
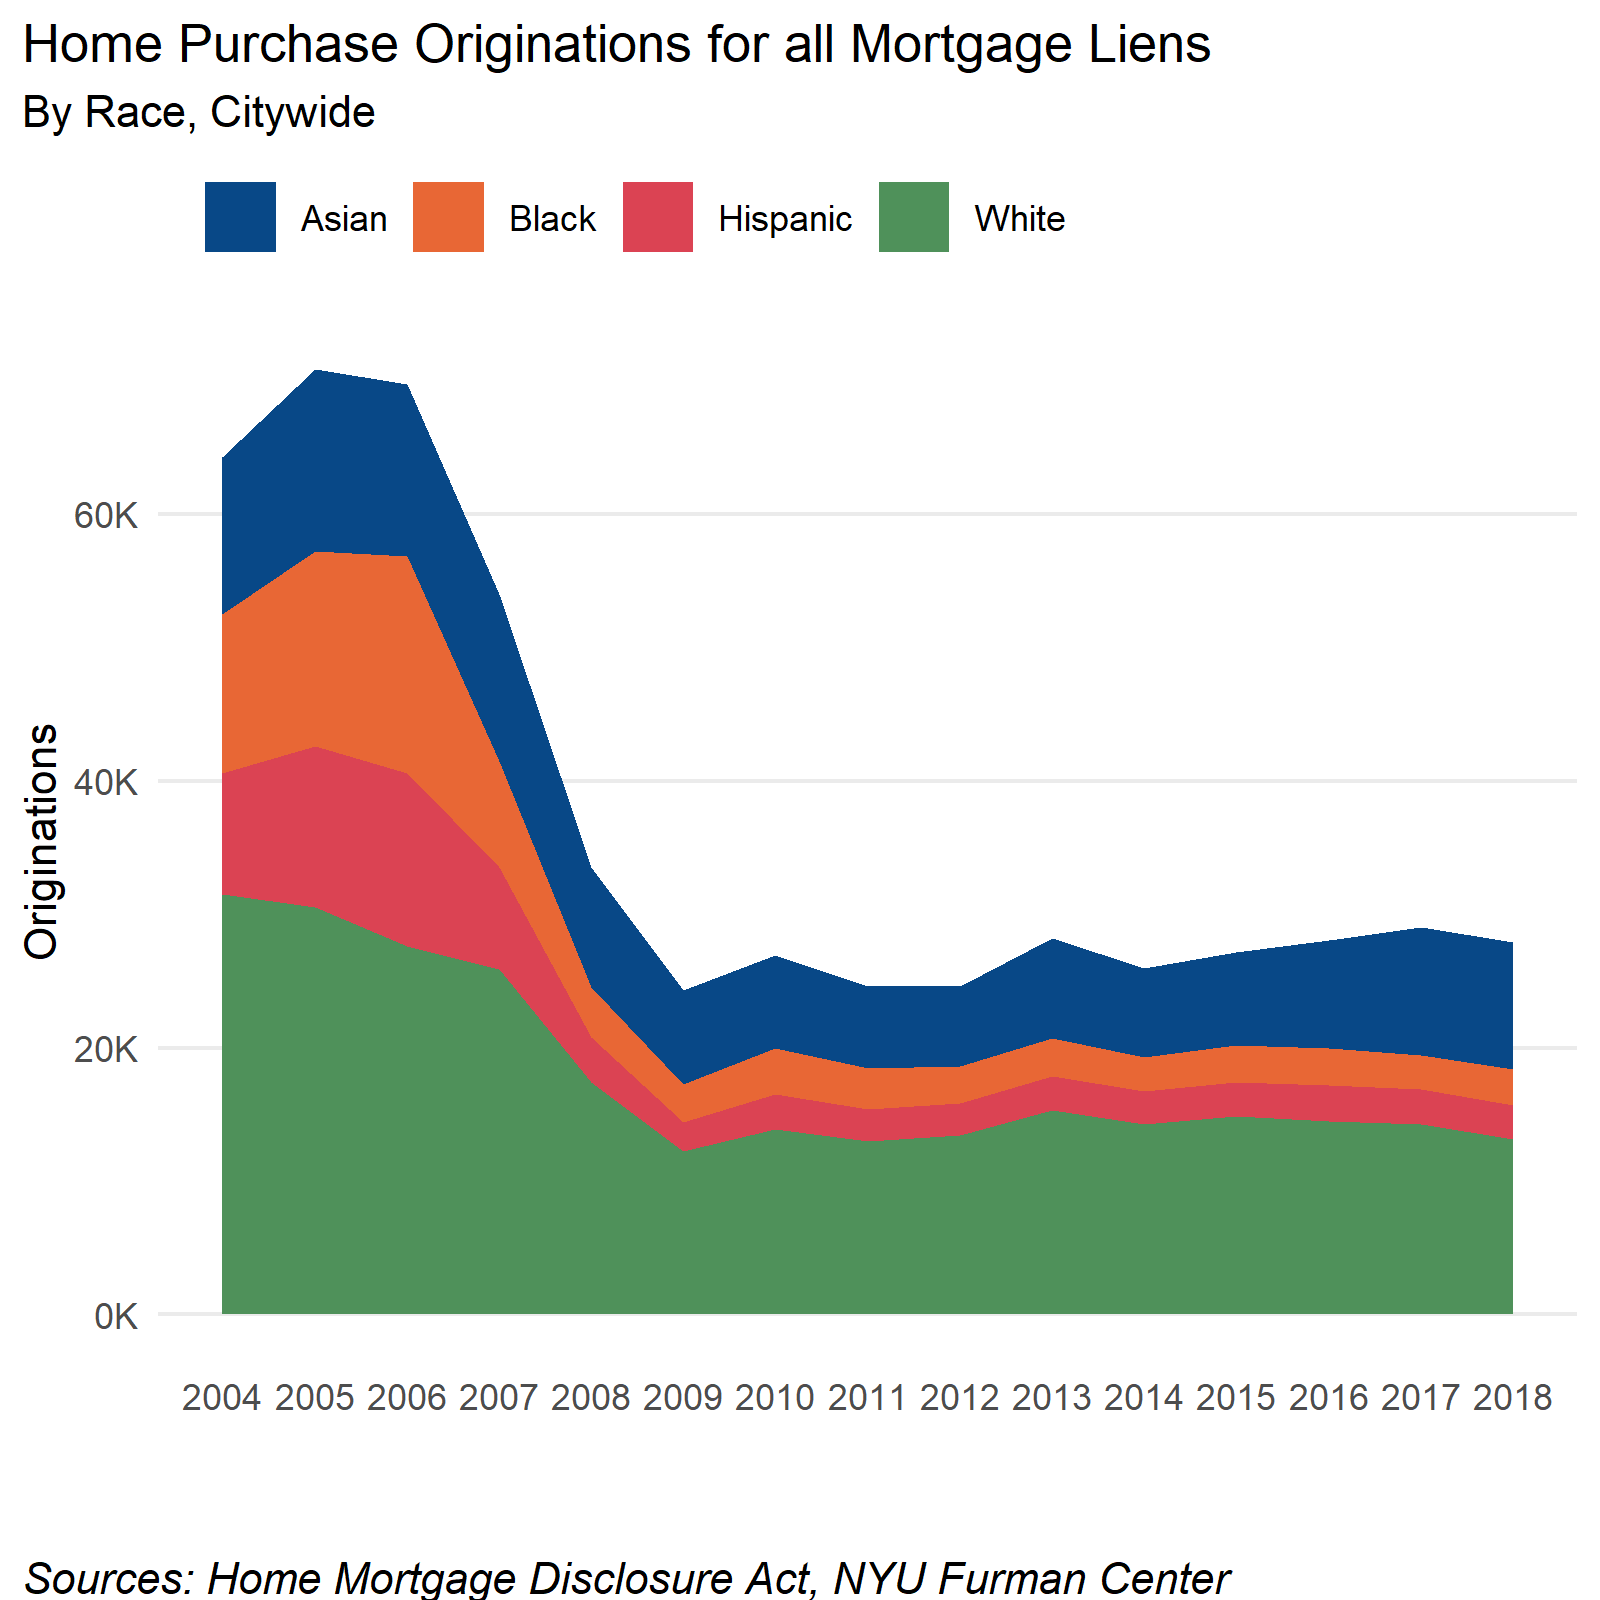
The number of home purchases made with mortgage loans has remained relatively constant since 2010, but remains significantly lower than the 2005 peak
Home purchase originations, or the number of new mortgages taken out by borrowers, have remained relatively constant following a large decline after the 2008 foreclosure crisis, but fell slightly in the last year. Like all other measures, there is geographic variation within these overall trends. The largest number of financed purchases in 2018 was in Queens, followed by Brooklyn, Manhattan, Staten Island, and the Bronx. The 2018 numbers resemble those from 2017 with little variation; the only notable change occurred in Manhattan, which saw 874 fewer home purchase loans originated in 2018 than 2017. The overall number of mortgage originations in 2018 was less than half of the mortgages originated in 2005.
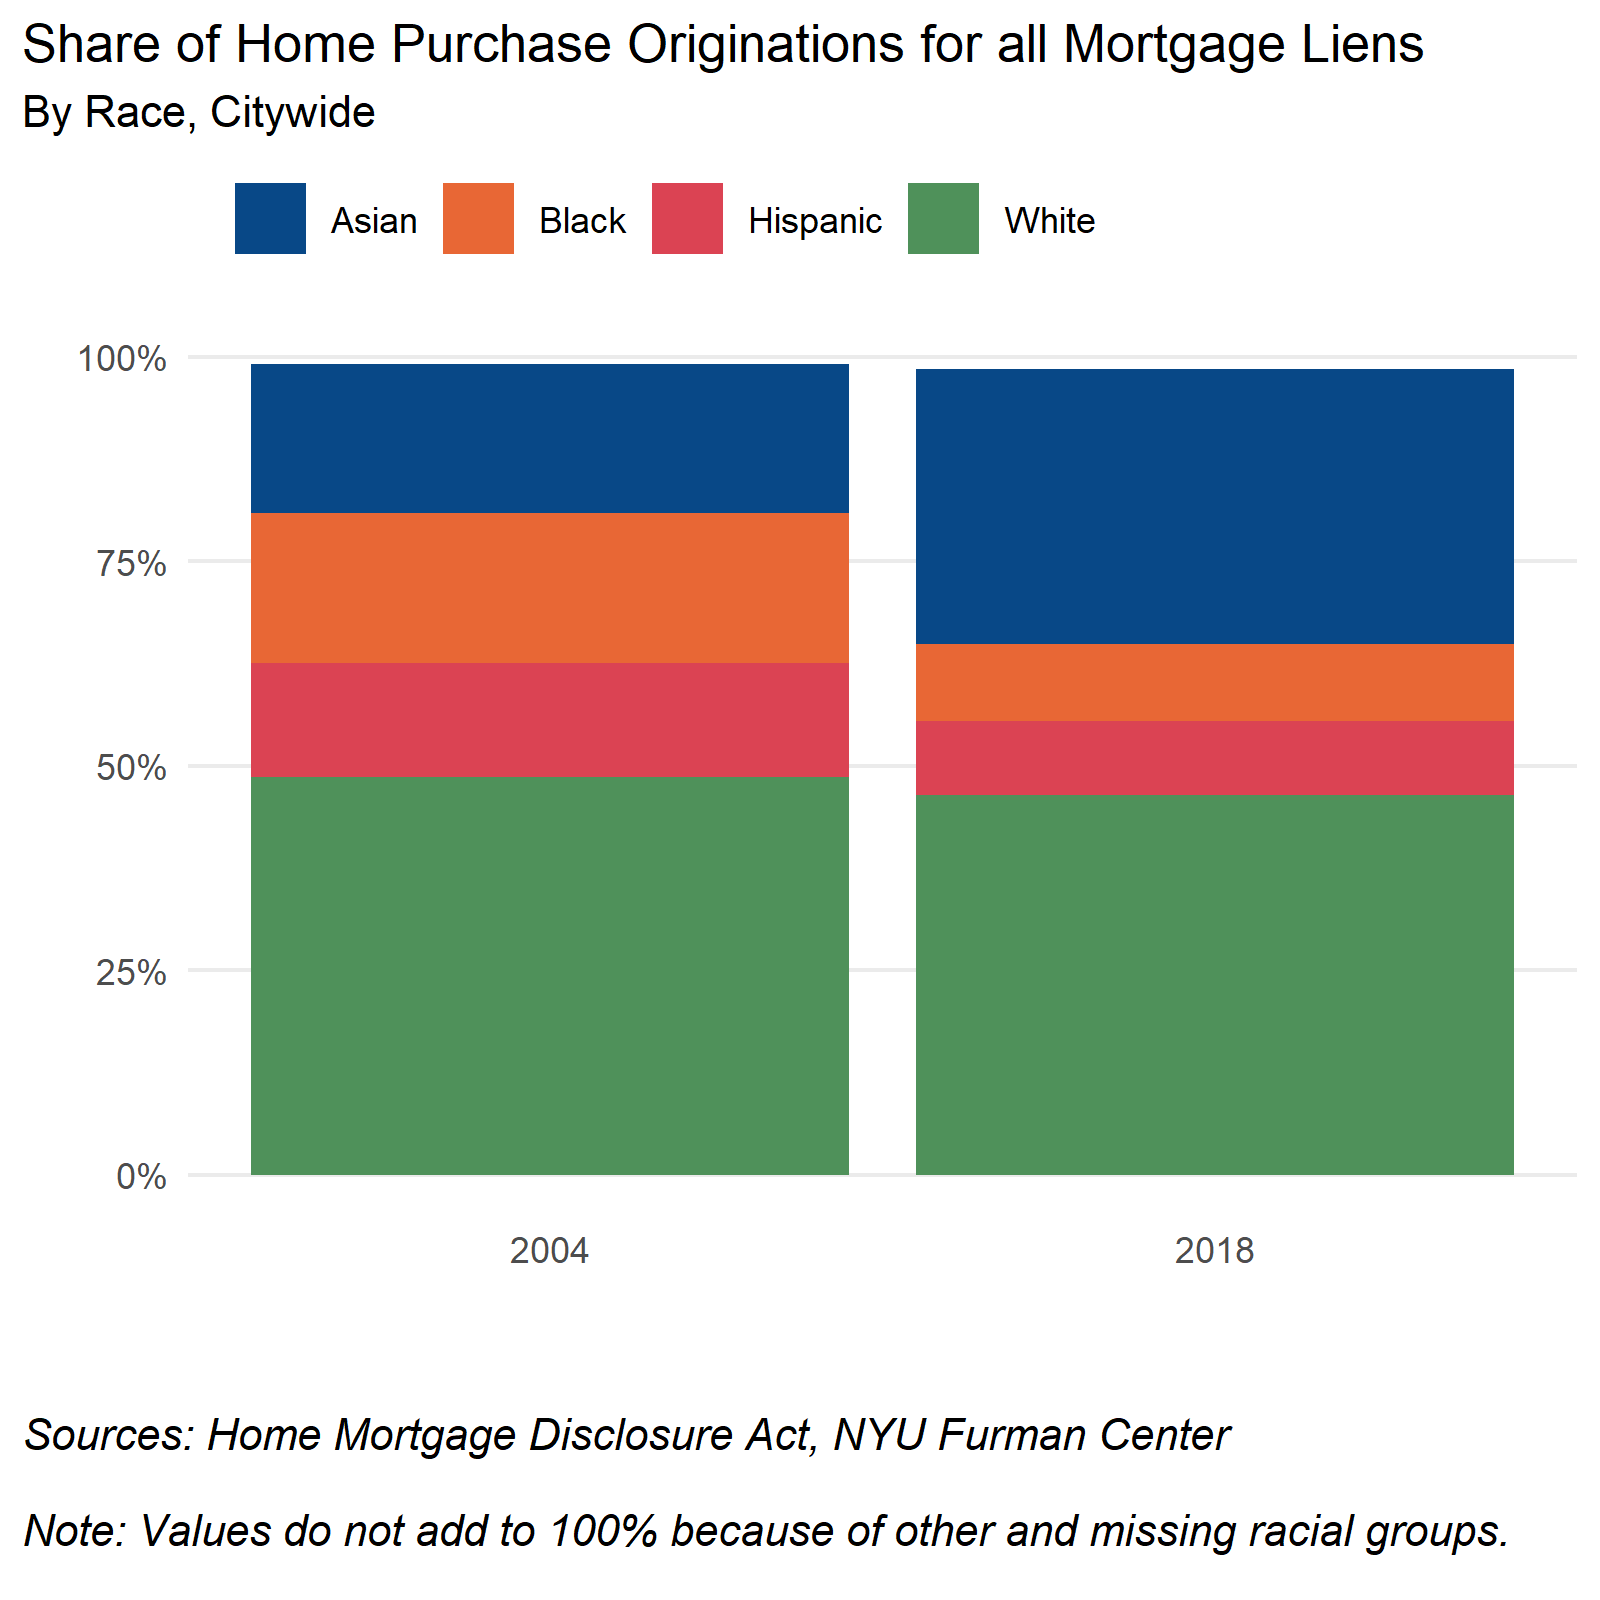
When examining home purchase originations by the race of the home purchaser, we see that the white share of borrowers remained relatively constant pre- and post- financial crisis, (declining roughly three percentage points) however the share of Asian borrowers grew from 18 percent to 34 percent. Conversely, the share of Black borrowers was cut in half, dropping from 18 percent to 9 percent, while the share of Hispanic borrowers decline from 14 percent to 9 percent.
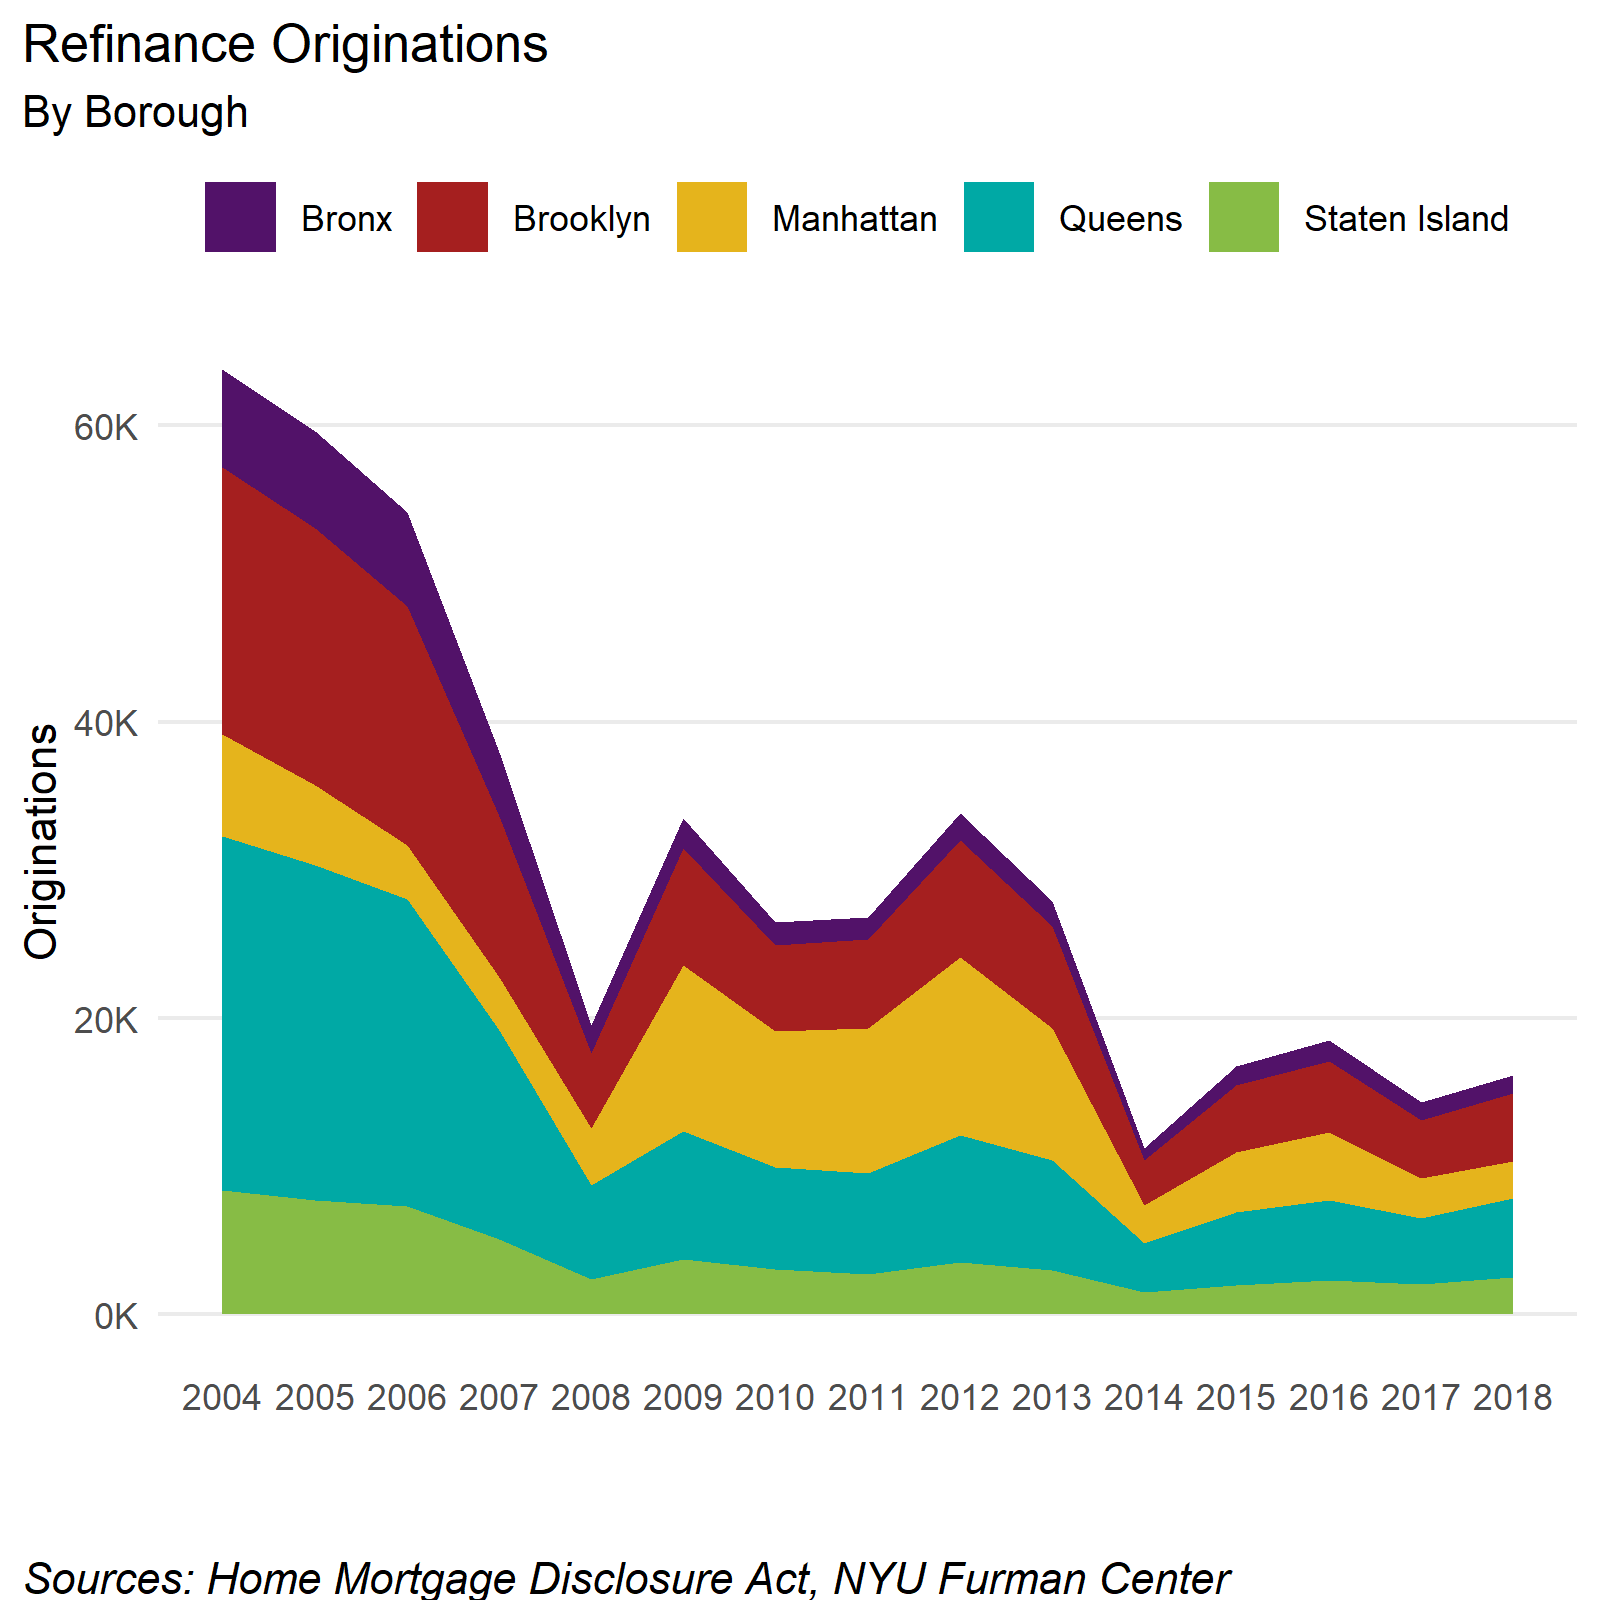
Mortgage refinancings increased slightly in 2018, with refinancing origination patterns varying by geography and race
Across the city, the total number of refinance originations increased between 2017 and 2018. The only borough that did not have an increase in refinancing originations was Manhattan (down 9 percent). The largest increase was in Staten Island (up 26 percent) followed by Brooklyn (up 17 percent), Queens (up 19 percent), and the Bronx (up 4 percent). This small decrease in Manhattan may be partially attributed to refinancing activity that took place right after the foreclosure crisis. Manhattan borrowers made up a much larger share of total refinancings between the 2009-2013 period than in the 2014-2018 period.
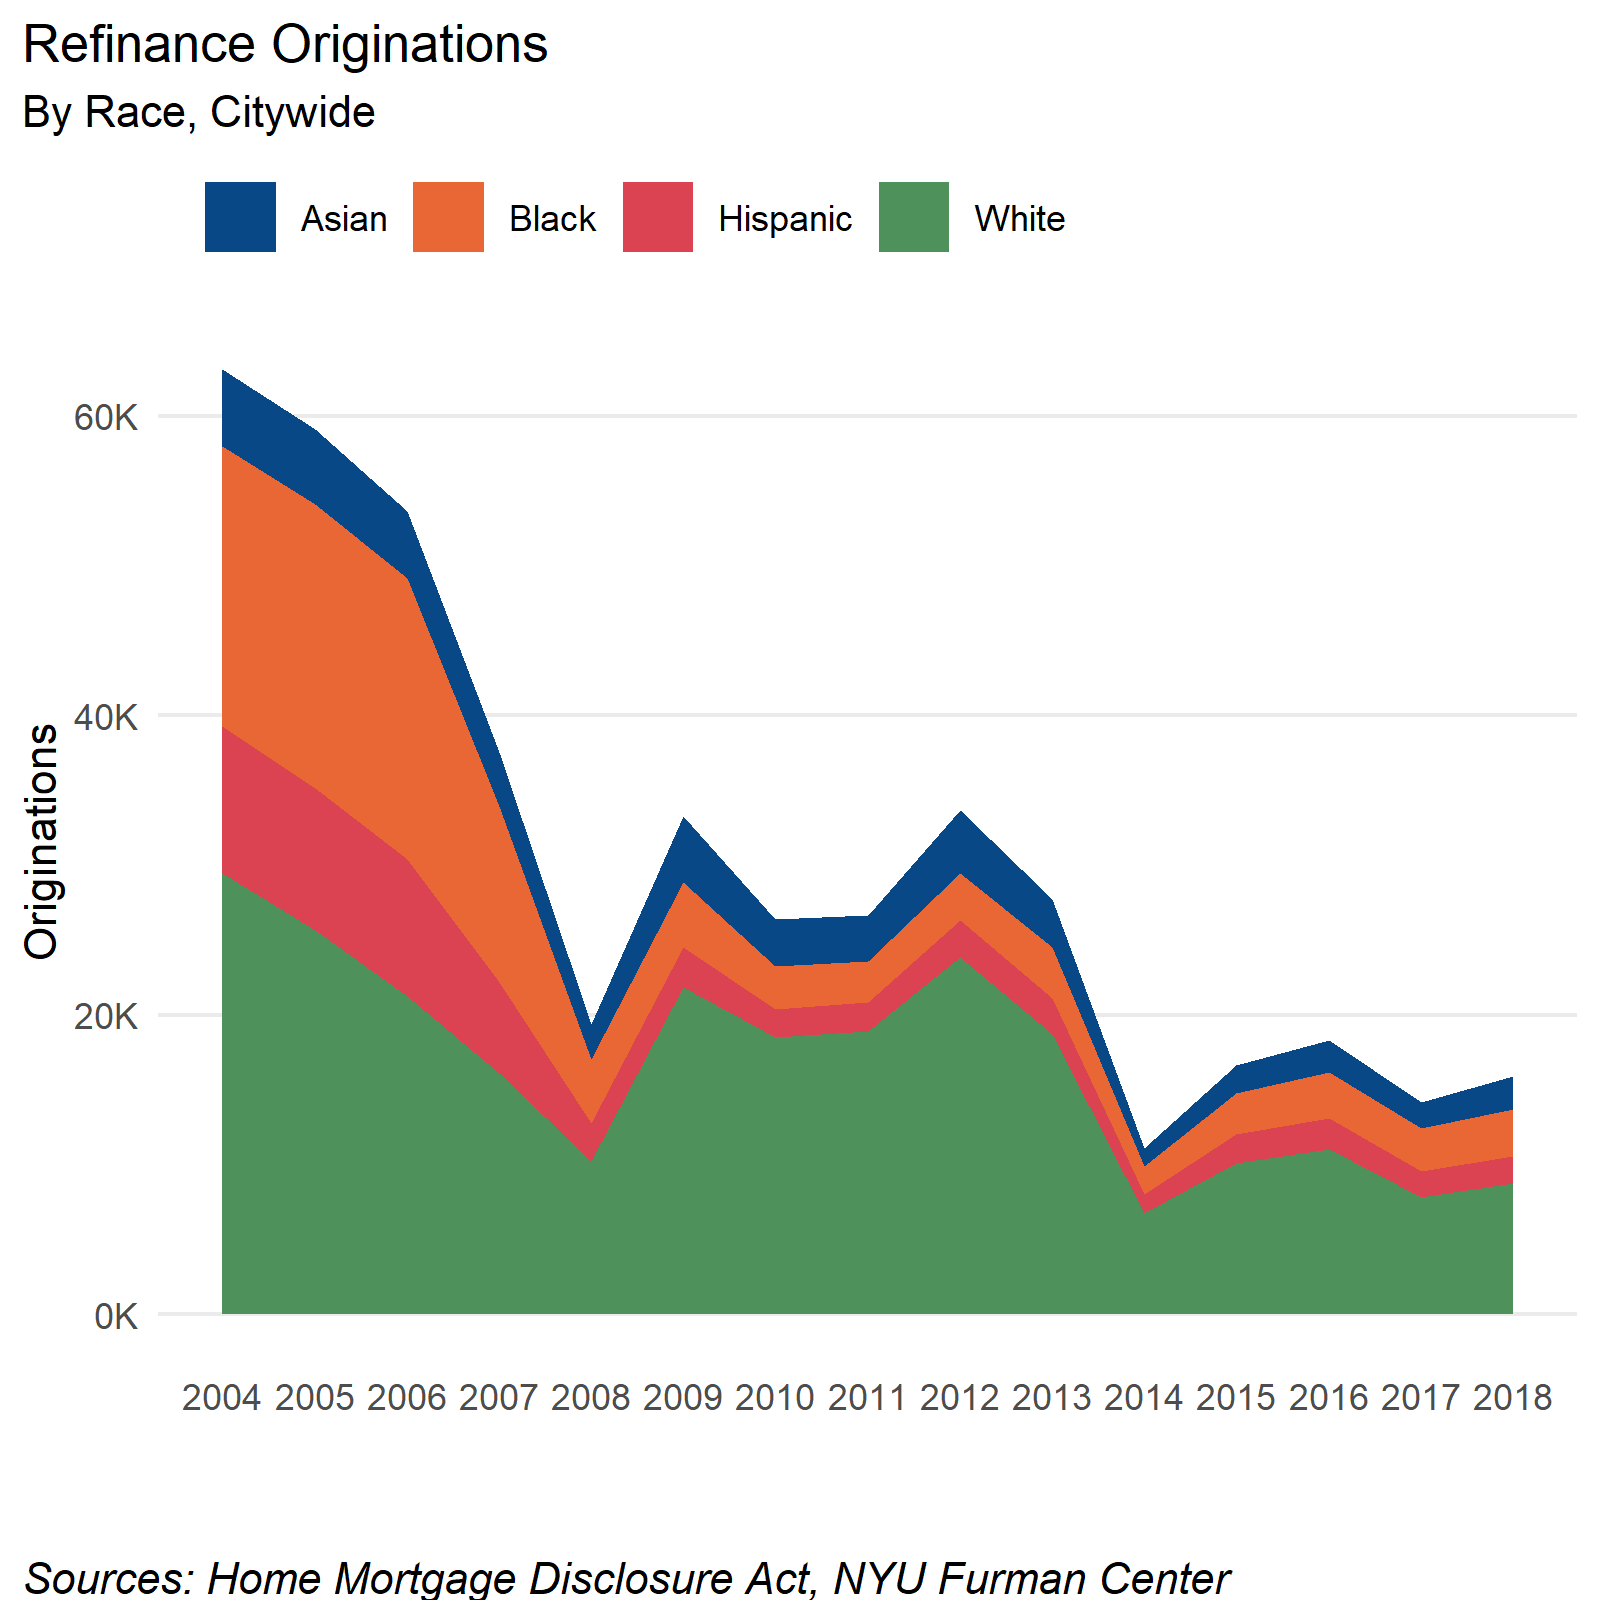
When examining refinancing originations by the race of the borrower, we see that the number of refinancing originations increased between 2017 and 2018 for every racial group tracked by HMDA. Similar to past periods, white borrowers made up the largest share of the total number of refinancing originations. The overall share of originations by race has changed since 2004, when Black and Hispanic households made up 29.3 percent and 15.3 percent of total mortgage refinancings respectively. In 2018, these shares fell to 19.4 percent and 11.5 percent respectively. As compared to 2004, Black and Hispanic households make up a smaller share of the mortgage refinancing market, and therefore may be less able to take advantage of current interest rates.
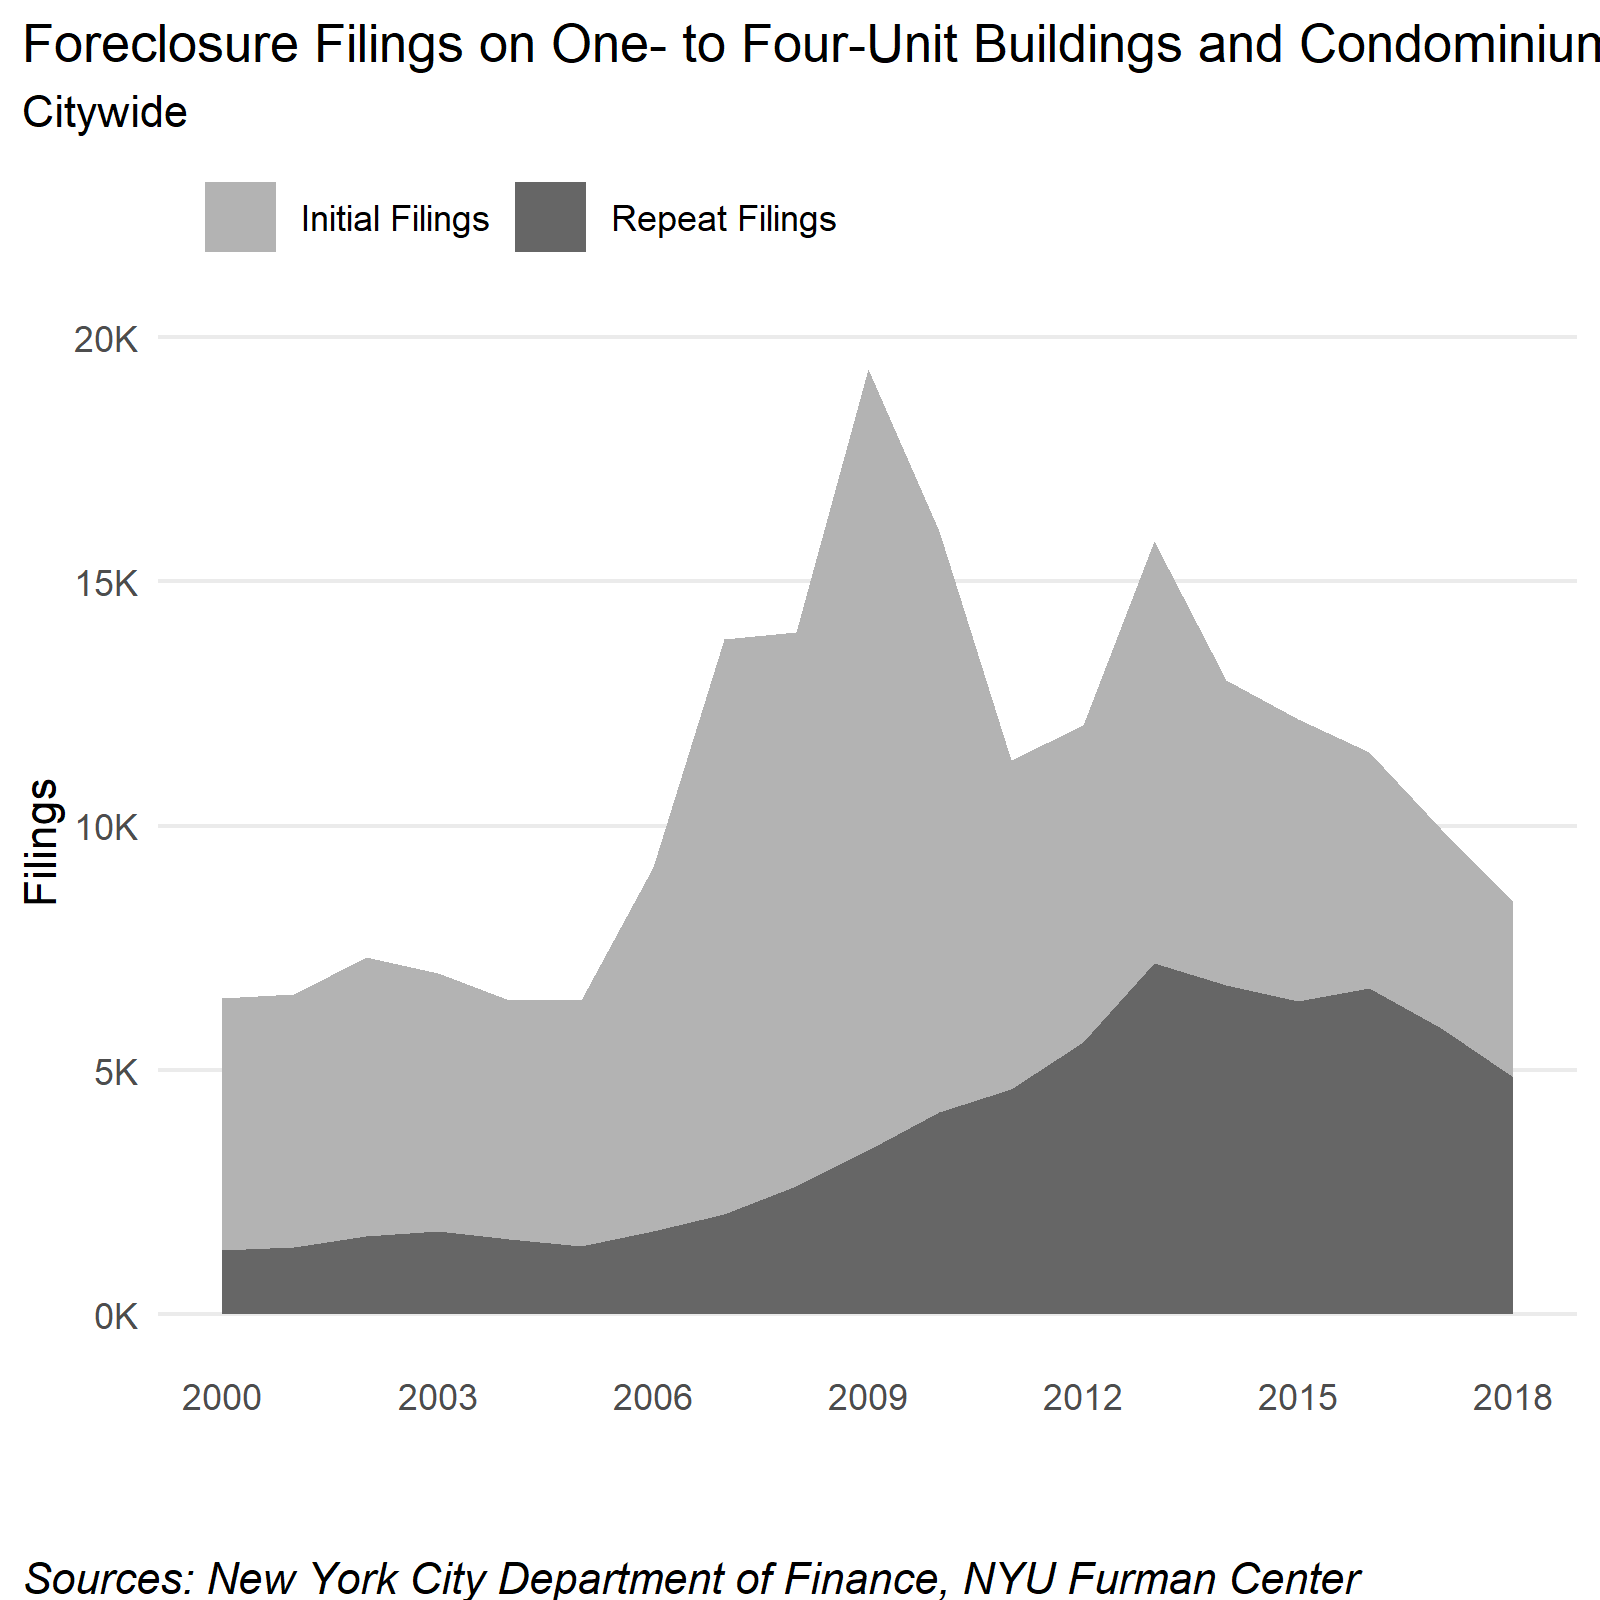
The number of foreclosure filings on one- to four-unit buildings has fallen since 2013, and it appears that 2019 will end with a smaller number of filings than in 2018
After peaking in 2009 and again in 2013, the total number of foreclosure filings for one- to four-unit buildings and condominiums fell continuously between 2014 and 2018. While total filings began to decline in 2014, repeat filings started decreasing in 2016, and still made up more than half (57%) of all foreclosure filings on one- to four-unit buildings and condominiums in 2018. The number of initial filings in 2018 was less than half of the number of initial filings from the 2013 peak, but still higher than the era prior to the foreclosure crisis.
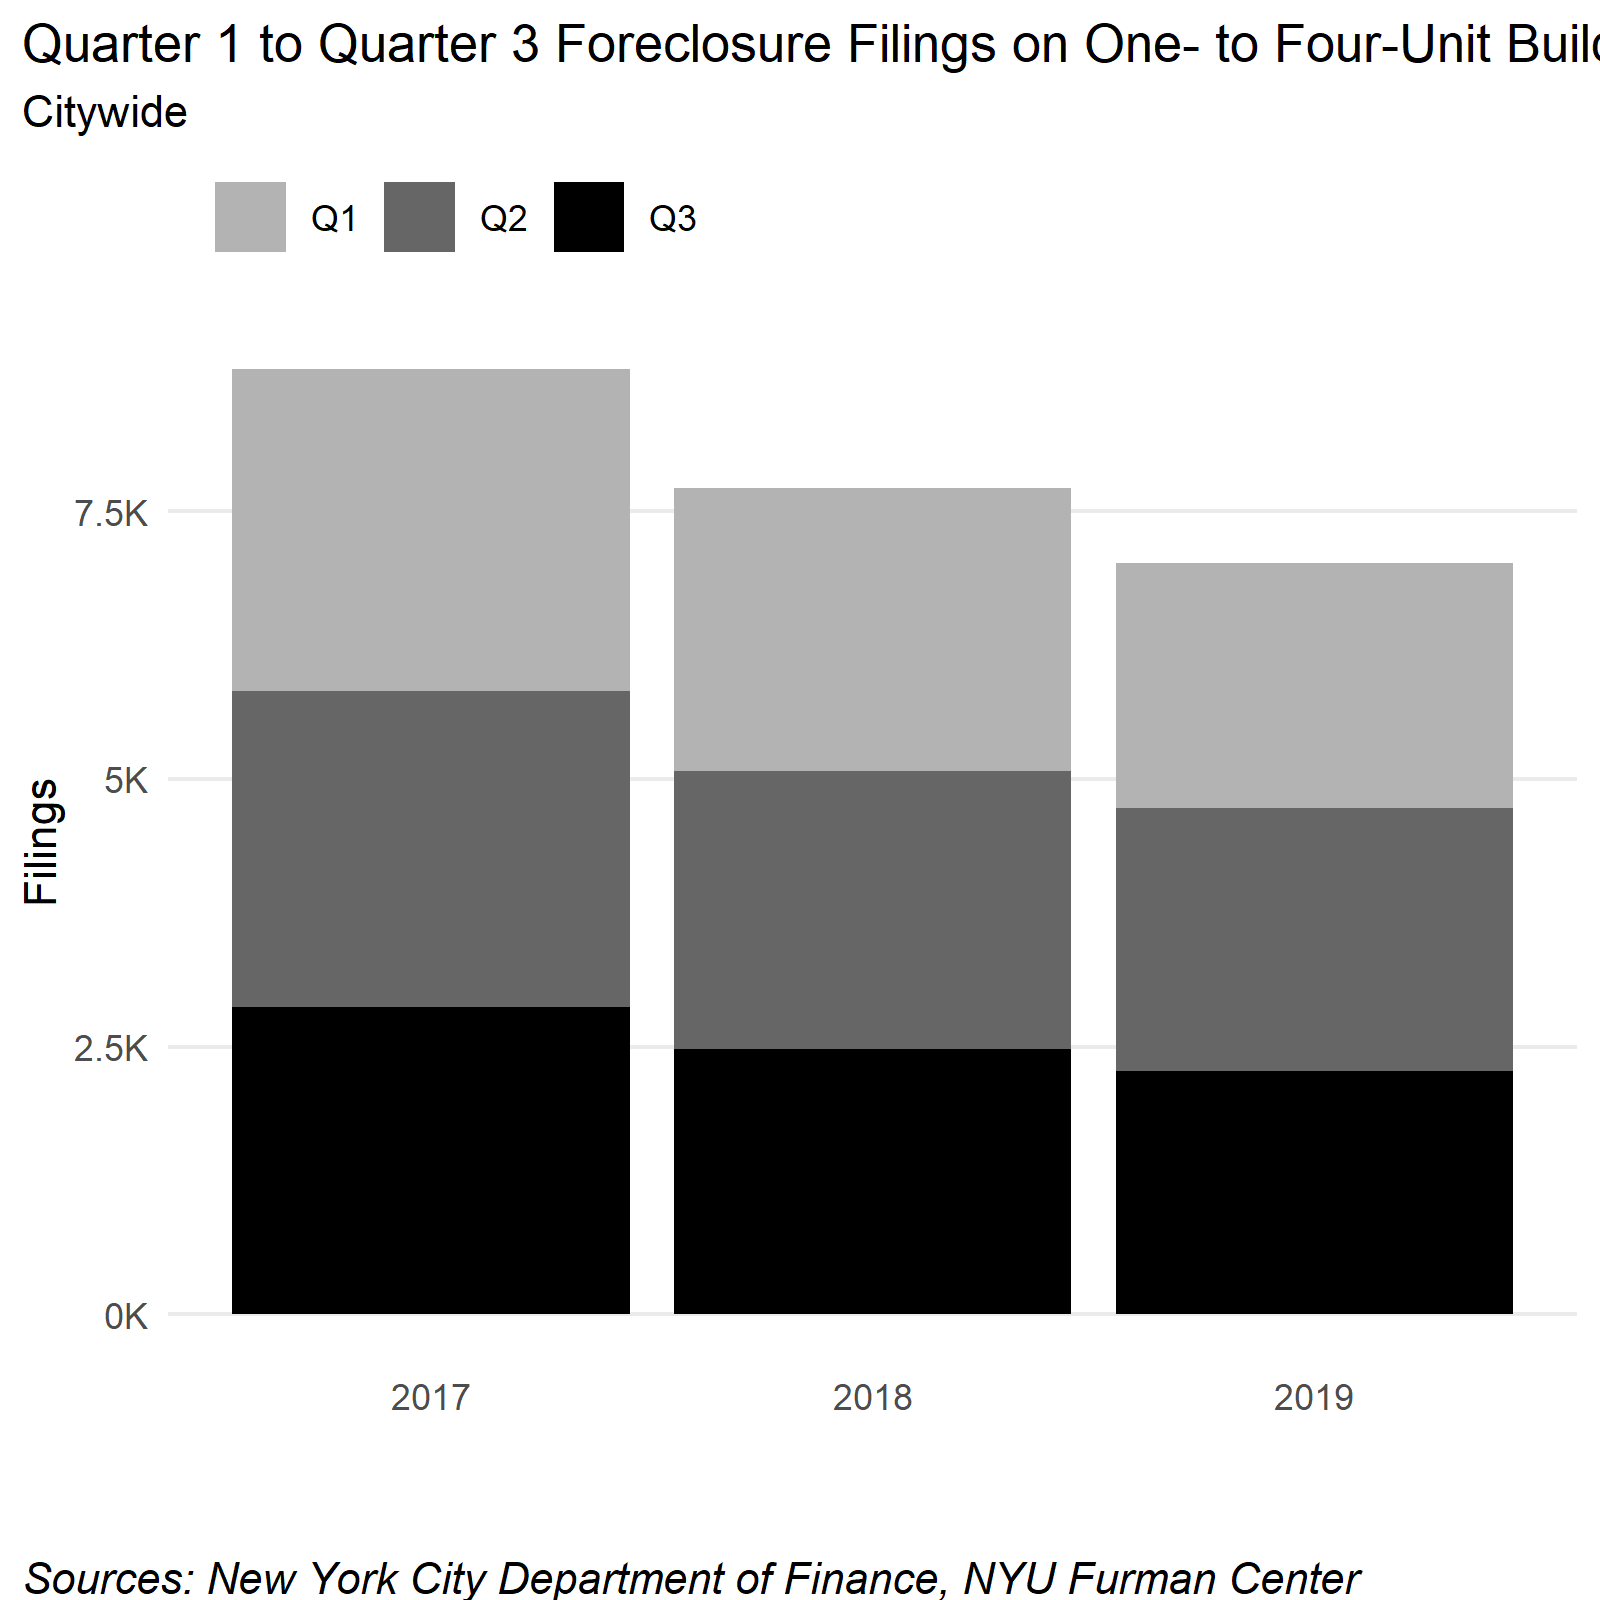
Based on the number of foreclosure filings on one- to four-unit buildings and condominiums to date (Quarter 1 through Quarter 3), it appears as though this decreasing trend will continue through 2019. Compared to the number of filings at this time last year, there were about 9 percent fewer filings (697) on one- to four-unit buildings and condominiums in 2019. This decrease is smaller than the 12 percent decrease between 2017 and 2018 (1,117 filings)
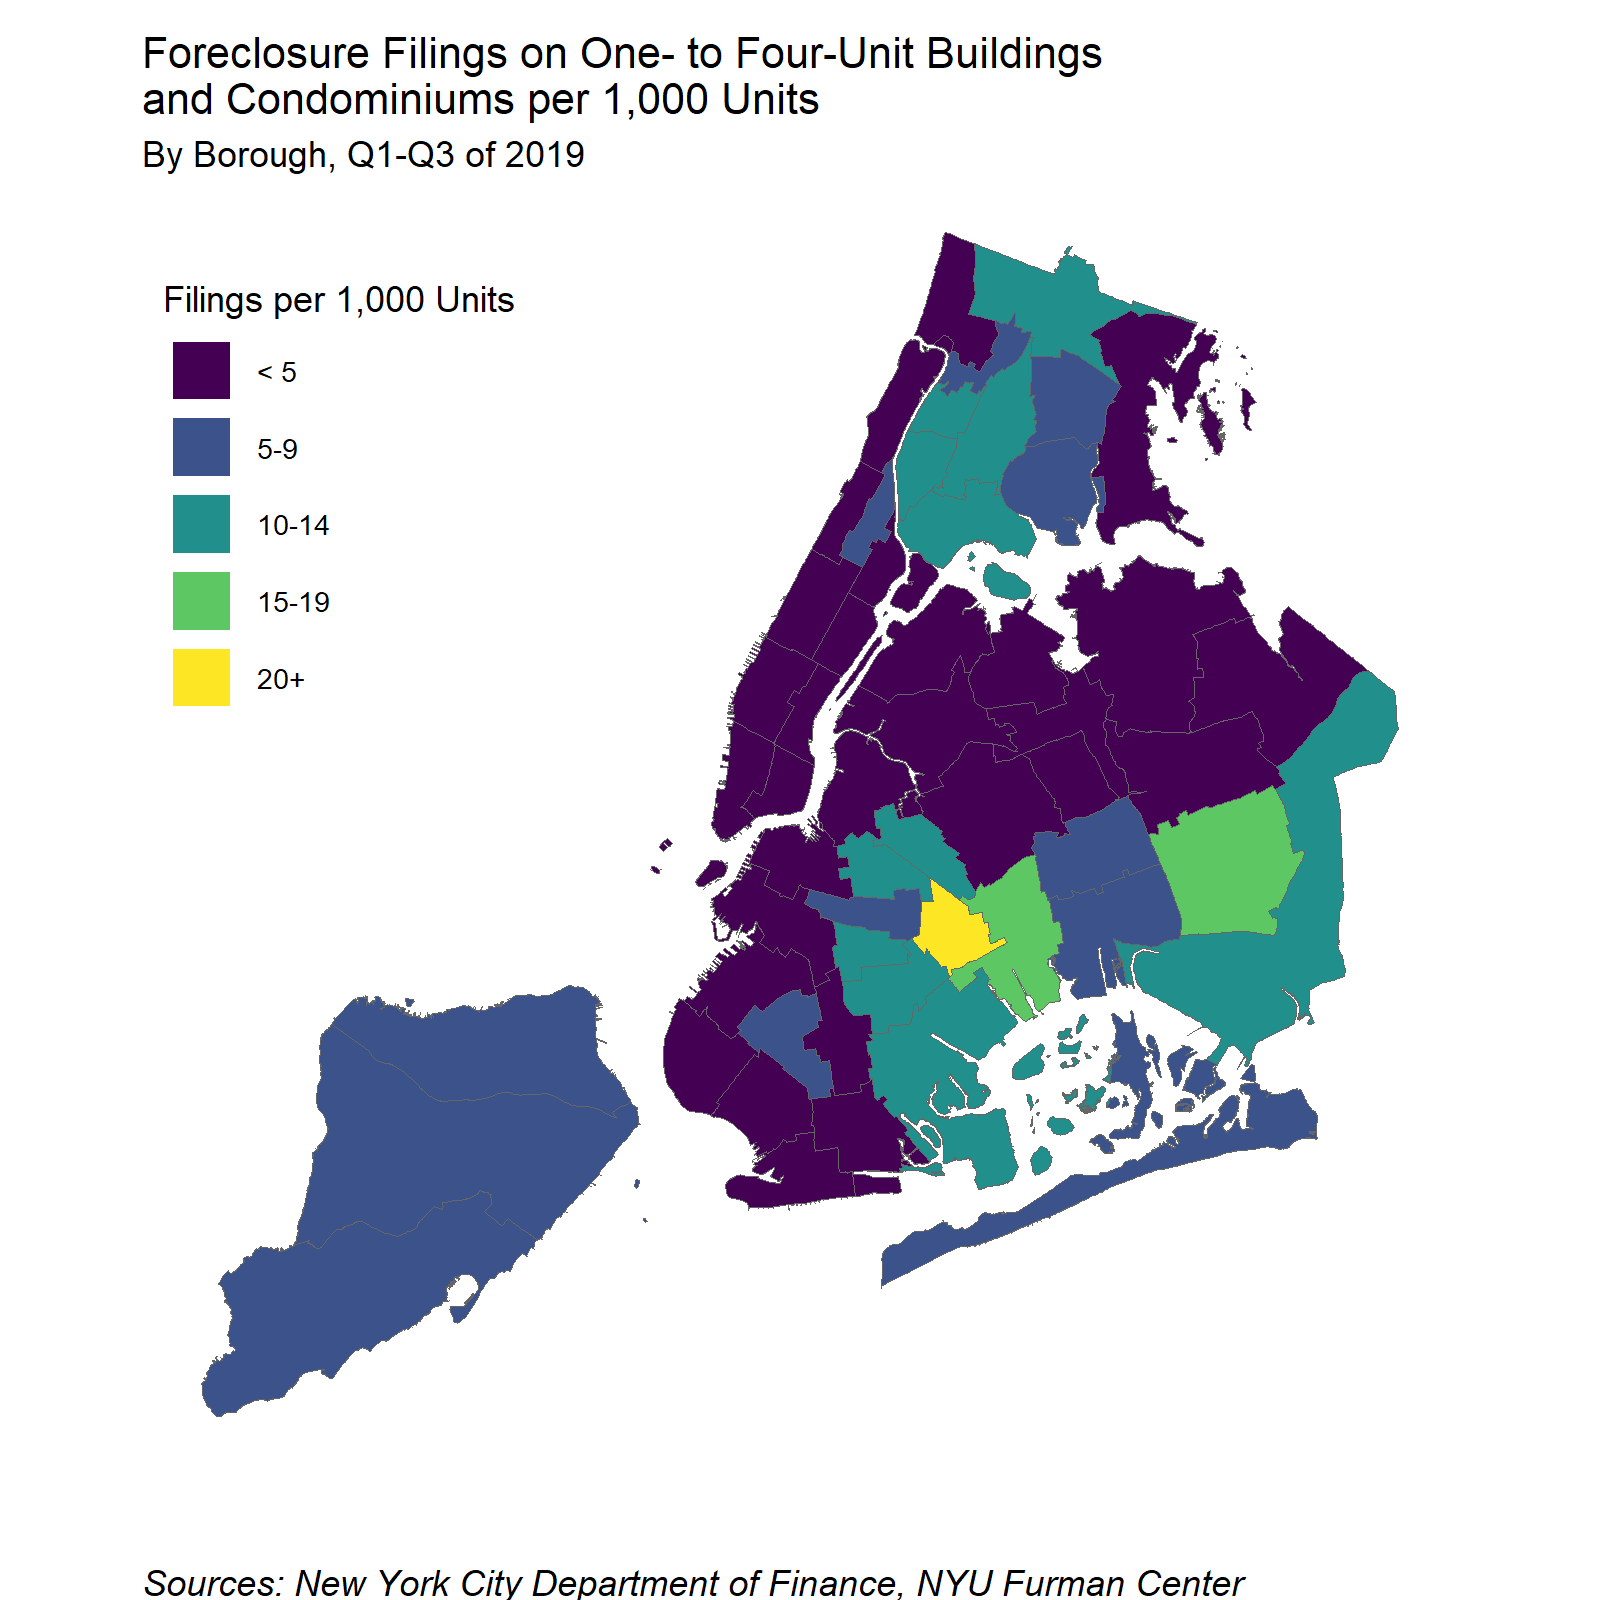
So far in 2019, the three sub-borough areas with the highest filing rates per 1,000 owner-occupied units were in eastern Brooklyn and southeast Queens: Brownsville (20.5%), Jamaica/Hollis (16.8%), and East New York/Starrett City (15.4%). The three sub-borough areas with the lowest filing rates were all in Manhattan: Washington Heights/ Inwood (0.1%), Lower East Side/Chinatown (0.5%), and Upper West Side (0.6%).
Conclusion
This analysis underscores the stark differences in homeownership by race and by borough. Black and Hispanic households purchase homes at a much lower rate than white and Asian households, and fewer of those that do own can take advantage of low interest rates by refinancing their mortgage. Recovery from the 2008 foreclosure crisis continues, though mortgage lending volumes remain significantly below pre-foreclosure crisis levels. The aftermath of the crisis and recovery also produced divergent results among homeowners: there were fewer severely and moderately cost burdened households with mortgages in 2018 than in 2008, yet for those that owned their homes “free and clear,” the share who were severely cost burdened households increased over the same period, though there’s potential wide variation in the financial picture for those households.