New York City Student Performance Varies Widely Across Neighborhoods
In New York City, student performance varies widely across neighborhoods and boroughs, according to data from the State of New York City’s Housing and Neighborhoods in 2015 report.
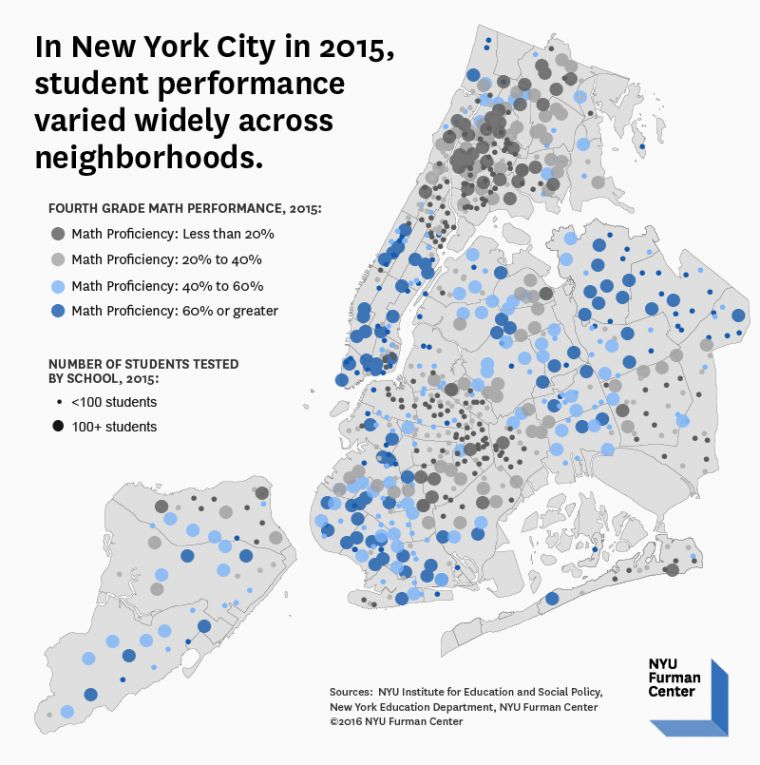
This map shows fourth grade math performance and the number of students tested by school in 2015. The map illustrates that lower-performing schools were concentrated in the southern and central Bronx, eastern Brooklyn, and northern Manhattan. In some neighborhoods, such as Queens Village (QN 13) in Queens, Flatlands/Canarsie (BK 18) in Brooklyn, and East Harlem (MN 11) in Manhattan, proficiency rates in neighboring schools differed by as much as 30 percentage points.
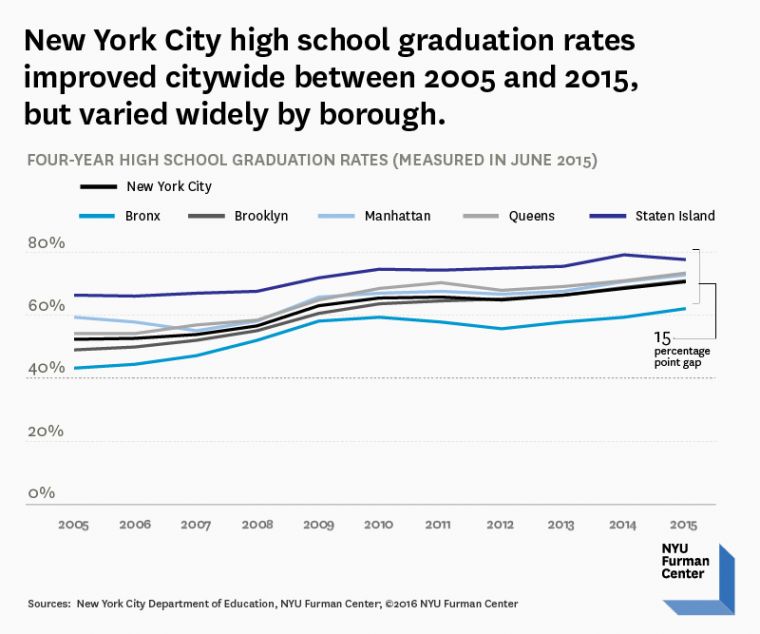
Over the last decade, graduation rates also varied across boroughs. Citywide, high school graduation rates grew dramatically between 2005 and 2015—from 52% in 2005 to more than 70% in 2015. But the figure below illustrates wide variations between boroughs. In 2015, the high school graduation rate in Staten Island was 77%, while the Bronx had a graduation rate of 62%—a 15 percentage point gap.
For more data on New York City’s neighborhoods, see the State of New York City’s Housing and Neighborhoods in 2015 report.