Citywide Sales Volume Down in 2016 as Housing Prices Continue to Rise
2016 NYC Housing Snapshot:
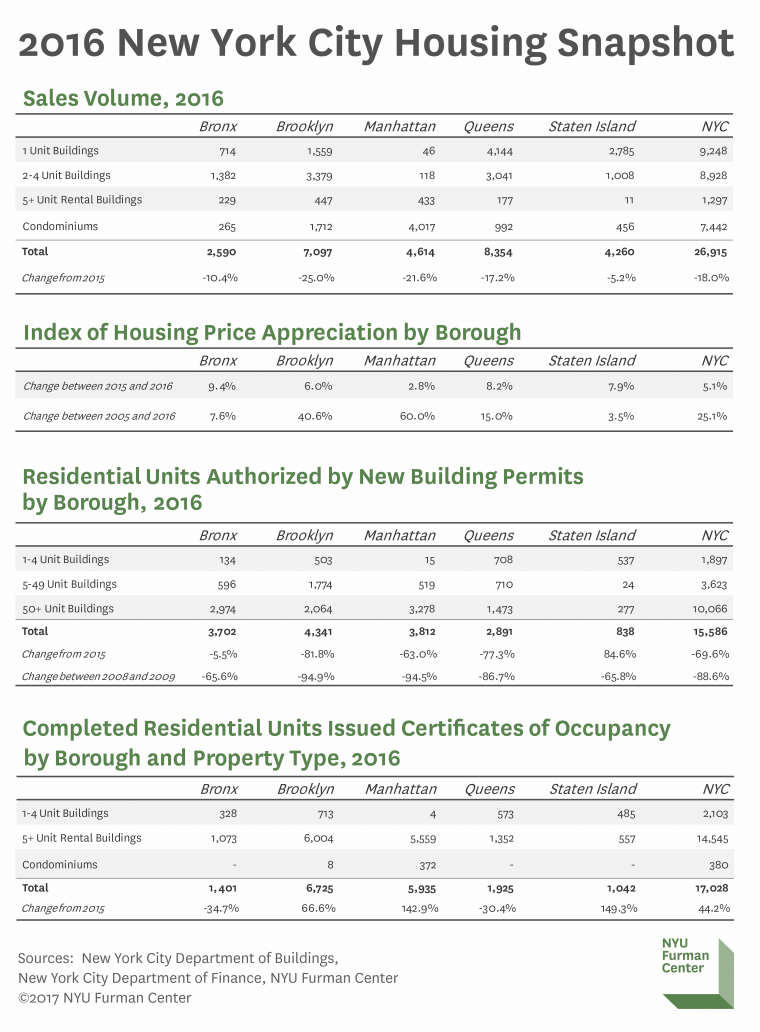
Below is a summary of housing sales, prices, and construction activity in 2016.
SALES VOLUME
In all five boroughs, the total number of property sales was lower in 2016 compared to 2015. The drop in sales volume was largest in Brooklyn (-25.0%), Manhattan (-21.6%), and Queens (-17.2%). The decline was smaller in the Bronx (-10.4%) and Staten Island (-5.2%). The drop in sales continued a decline since 2013 for Manhattan, but was a change in direction for the Bronx and Staten Island, which had seen yearly increases in sales volume since 2011.
INDEX OF HOUSING PRICE APPRECIATION
Between 2015 and 2016, home prices rose by just over five percent in New York City. The Bronx had the largest rate of growth in 2016 (9.4%), followed by Queens (8.2%), Staten Island (7.9%), and Brooklyn (6.0%). Manhattan experienced more modest growth, with an increase of 2.8 percent in home prices. However, this follows a decade of much greater growth for Manhattan and Brooklyn compared to the other boroughs. Between 2005 and 2016, Manhattan home prices increased by 60.0 percent, and Brooklyn home prices increased by 40.6 percent. By contrast, Staten Island and Bronx are only now recovering from the Great Recession with home prices up by 3.5 percent in Staten Island and 7.6 percent in the Bronx since 2005.
BUILDING PERMITS
In 2016, there was a sharp decrease citywide in the number of building permits issued for new housing units compared to the previous year. The decline, however, was not surprising given that permits spiked in 2015 as developers tried to get their projects in the ground before the 421-a property tax exemption expired. The city experienced a similar increase in building permits in 2008 during a period of uncertainty about the future of 421-a, though the subsequent decline in 2009 was much sharper than the 2016 decline, much of which occurred in the first half of the year. In 2016, approximately 12 percent of the newly authorized housing units were in one- to four-unit buildings; about 23 percent were in buildings with five to 49 units; and about 65 percent were in buildings with 50 or more units. While far fewer units in larger buildings were permitted in 2016 than in the previous year, the number of authorized units in one- to four-unit buildings — which would not have been eligible for the 421-a exemption — increased five percent over the same period.
NEWLY COMPLETED RESIDENTIAL UNITS
Over 17,000 new residential units were authorized for occupancy in 2016, a 44 percent increase from 2015 levels. Eighty-five percent of the new units receiving a certificate of occupancy were in rental buildings with five or more units; only two percent of new units were in condominium buildings —the lowest level and share since at least 2000. View the interactive map on CoreData.nyc.