COVID-19 Cases in New York City, a Neighborhood-Level Analysis
As of April 8th, New York City had over 80,000 cases of novel coronavirus. These cases are not evenly distributed across the city, nor is mortality from the disease. Neighborhoods with higher rates of confirmed COVID-19 cases have lower median incomes, higher shares of residents who are Black or Hispanic, and higher shares of residents under the age of 18 relative to less affected neighborhoods. Residents of these neighborhoods are less likely to be able to work from home, disproportionately rely on public transit during the crisis, and are less likely to have internet access. Finally, we find that areas with higher numbers of confirmed COVID-19 cases have lower population density, yet they do have higher rates of overcrowding at the household level.
Further, we see large disparities in mortality rates from COVID-19 across the five boroughs. To date, the Bronx has seen the highest rate of deaths per capita from the virus. This may result from higher rates of underlying health conditions that increase the risk of severe cases, or from more limited access to health care. Citywide data confirm that mortality rates due to COVID-19 are highest among Hispanic, Black, and non-Hispanic/Latino Other populations.
To examine disparities in incidence across neighborhoods, we divide the city’s ZIP Codes (the lowest level geography of publicly available data) into quintiles based on the number of cases per 1,000 people. The top 20 percent of ZIP Codes form the highest quintile, the next 20 percent form the 4th quintile, and so on. We then review racial composition and key indicators by quintile. We caution that the number of positive cases is clearly an undercount: testing for the coronavirus has been limited, and the prevalence of testing likely varies across different areas, meaning that the undercount may be higher in some neighborhoods than others.
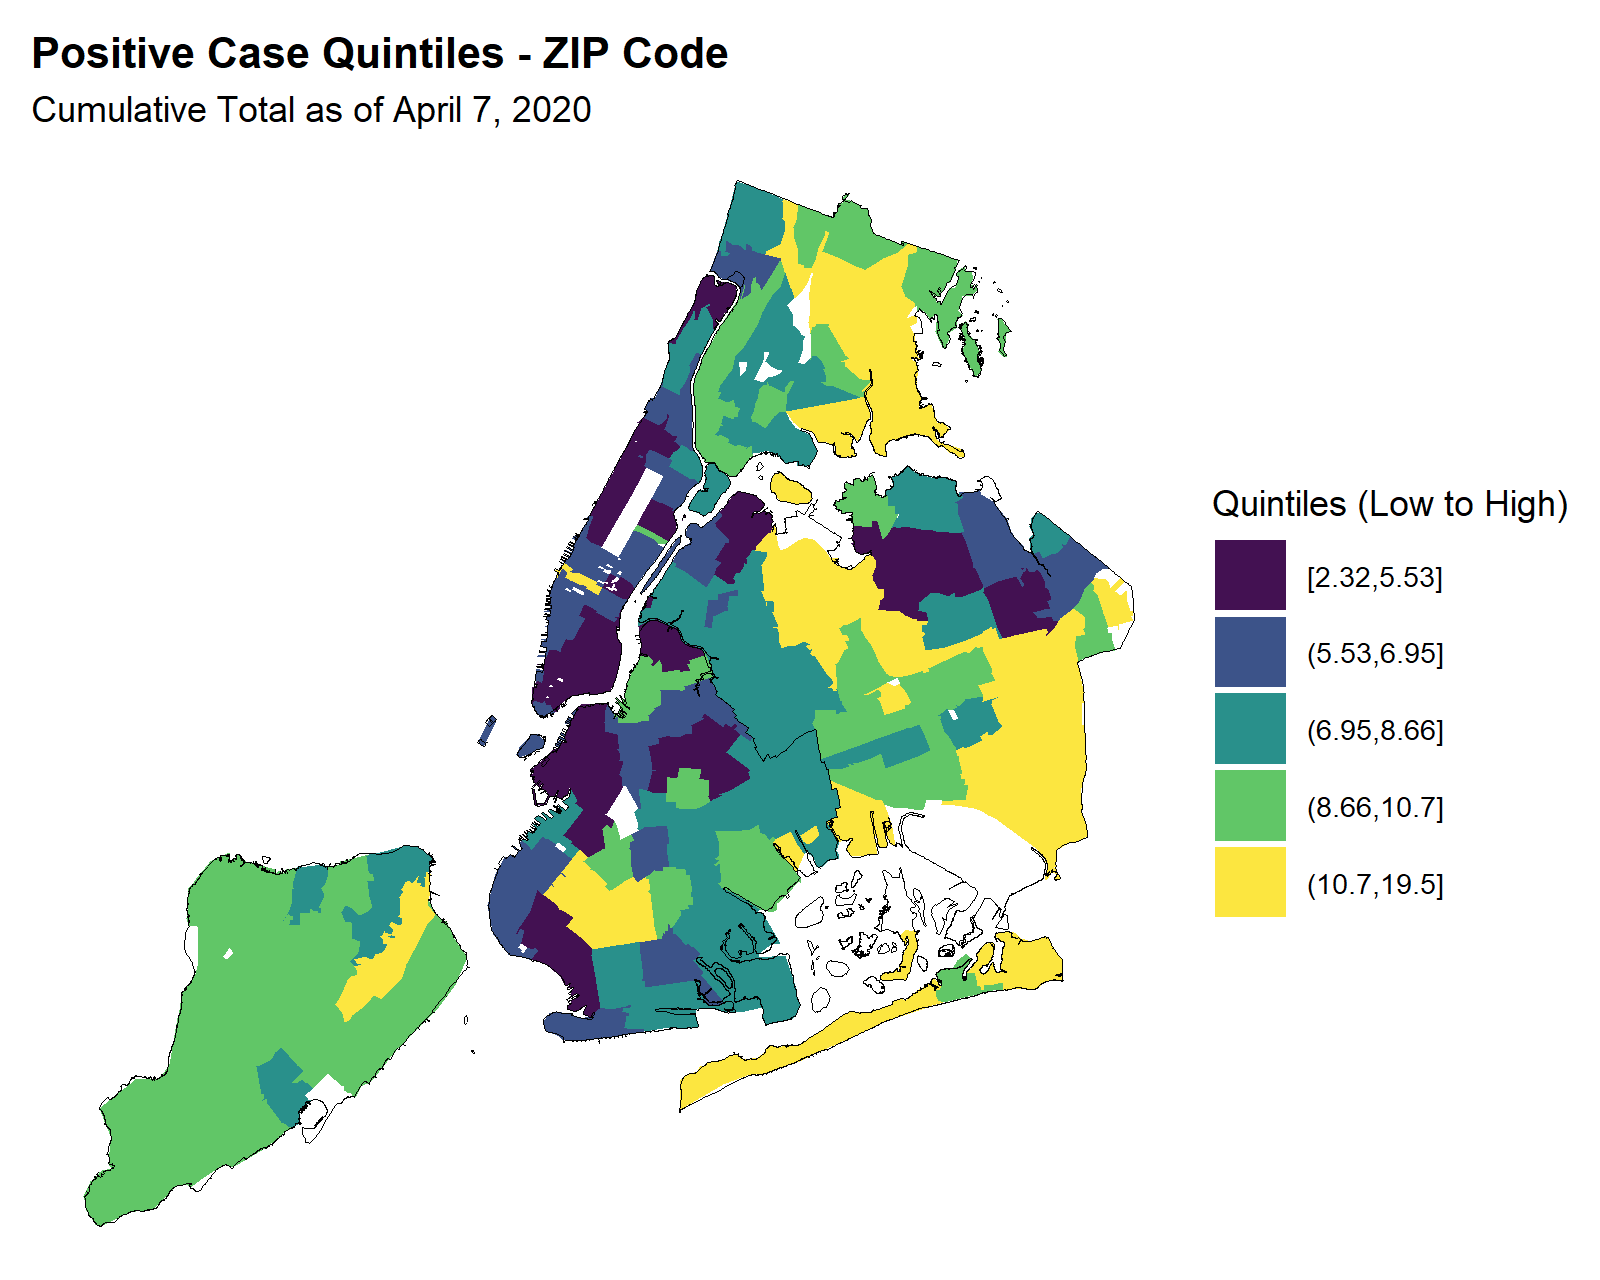
Table 1: Neighborhood Indicators by COVID-19 Positive Case Quintiles
|
|
|
|
|
|
|
|
Cases per 1,000 People |
2.32 - 5.53 |
5.53 - 6.95 |
6.95 - 8.66 |
8.66 - 10.7 |
10.7 - 19.5 |
| Racial Composition | |||||
|
Share Asian |
20.2% |
13.6% |
9.8% |
11.3% |
15.0% |
|
Share Black |
13.0% |
18.0% |
26.3% |
24.8% |
26.6% |
|
Share Hispanic |
18.0% |
25.2% |
38.1% |
31.8% |
30.5% |
|
Share White |
45.9% |
40.5% |
22.8% |
28.7% |
25.1% |
| Economic Indicators | |||||
|
Poverty Rate |
15.6% |
19.1% |
22.4% |
19.6% |
17.3% |
|
Median Income |
$80,566.45 |
$68,404.12 |
$49,372.77 |
$58,409.36 |
$57,498.00 |
|
Share College Educated |
54.6% |
48.8% |
26.5% |
30.3% |
27.3% |
| Connection Indicators | |||||
|
Share with |
14.4% |
15.2% |
19.9% |
17.9% |
19.0% |
|
Share with |
10.5% |
11.6% |
14.6% |
12.6% |
13.7% |
| Public Transit Use | |||||
|
Average Change |
-89.9% |
-89.2% |
-80.1% |
-79.9% |
-82.9% |
| Density Indicators | |||||
|
Share Renters |
70.5% |
73.5% |
70.6% |
60.8% |
59.4% |
|
Share Renters Overcrowded |
7.3% |
8.9% |
12.5% |
13.0% |
15.2% |
|
Population Density |
48,067 |
47,845 |
29,050 |
20,144 |
25,082 |
|
Share Housing in |
63.7% |
71.0% |
47.7% |
44.9% |
41.7% |
| Other Demographic Indicators | |||||
|
Share Foreign Born |
32.4% |
33.1% |
41.1% |
36.7% |
41.0% |
|
Share Under 18 |
16.3% |
18.2% |
22.6% |
23.7% |
23.2% |
|
Share Over 65 |
15.1% |
14.7% |
13.2% |
12.8% |
14.8% |
Areas with higher rates of COVID-19 have higher Black and Hispanic population shares on average, and lower Asian and white shares.
COVID-19 appears to have had a disparate impact on communities of color. The share of the population that is Black and Hispanic is 13.6 and 12.5 percentage points higher, respectively, in the top quintile than in the bottom quintile. Meanwhile, the share of residents who are white falls with the rate of positive cases. These differences align with racial differences in teleworking nationally.
There are higher rates of confirmed COVID-19 cases in areas where less of the population is able to work from home.
People with college degrees are more likely to be able to work remotely, and the data show that the share of adults with college degrees decreases as the prevalence of coronavirus cases increases. The difference between the lowest and highest quintile is considerable (54.6% versus 27.3%). Households in the lowest quintile are also more likely to have access to the internet than households in ZIP Codes with higher rates of the coronavirus.
While MTA Subway ridership dropped dramatically across the city, areas with higher rates of COVID-19 saw a smaller decline.
For workers unable to stay home, reliance on public transit to get to and from work may also affect neighborhood vulnerability to coronavirus transmission. Weekday public transit use dropped by 89.9 percent on average for the ZIP Codes in the lowest quintile; the highest quintile saw a drop of 82.9 percent.
COVID-19 is more prevalent in areas where more people reside in crowded units.
Living in close quarters may compound risk of exposure. This risk would be even greater for households with non-remote workers, as those workers are more likely to become infected by the virus. The ZIP Codes in the highest and lowest quintiles of per capita infections have notably different shares of overcrowded renters – defined as the share of renter households with more than 1 person per room – at 15.2 percent and 7.3 percent, respectively.
Overall population density is not associated with higher rates of COVID-19 cases.
While ZIP Codes with higher rates of cases see higher rates of overcrowding within the household, the opposite is true of measures of neighborhood level density. ZIP Codes with a higher density and a larger share of housing in large buildings (with 10 or more units) have some of the lowest rates of cases per 1,000 people.
ZIP Codes with a higher share of population under the age of 18 also have more positive cases.
Recent research indicates that children may be at risk of transmitting COVID-19, in part because they are less likely to exhibit symptoms. The highest quintile indeed has a higher share of residents under the age of 18, compared to the lowest quintile (23.2% and 16.3%, respectively). However, it remains unclear whether children are accelerating transmission or whether these differences are driven by the fact that households with young children have lower incomes on average.
Table 2: COVID-19 Deaths and Health and Poverty Indicators by Borough
|
|
|
|
|
|
|
|
COVID-19 Deaths |
1,001 |
1,185 |
5,000 |
1,344 |
229 |
|
COVID-19 Deaths |
0.71 |
0.46 |
0.31 |
0.60 |
0.48 |
|
% of population |
12.8 |
13.9 |
16.5 |
15.7 |
16.2 |
|
Poverty rate |
27.3 |
18.9 |
15.6 |
11.6 |
11.7 |
|
% without health insurance |
8.9 |
8.0 |
6.2 |
10.2 |
4.9 |
|
% with diabetes |
16.0 |
11.7 |
8.5 |
10.5 |
9.7 |
|
Asthma emergency department |
242.9 |
123.6 |
133.6 |
74.0 |
66.2 |
|
% with hypertension |
32.3 |
31.2 |
21.2 |
32.7 |
31.0 |
Sources: New York City Department of Health, US Census Bureau, New York State Department of Health
While data on mortality due to COVID-19 is unavailable at the ZIP Code level, at the Borough level, the Bronx has the highest rate of deaths due to the virus.
A lack of detailed data on deaths due COVID-19 prevents us from looking at mortality rates at the neighborhood level. But we see substantial disparities across boroughs. In the Bronx, the rate of COVID-19 related deaths was 0.71, followed by 0.60 in Queens. While the Bronx has a lower share of people over 65 years old compared to other Boroughs, its poverty rate is much higher than the rest of the City, at 27.3 percent.
The Bronx leads the city in terms of the prevalence of diabetes and asthma, two underlying conditions that put patients at higher risk of a more severe case of COVID-19.
Underlying health conditions may contribute to the difference in mortality rates due to COVID-19. Bronx residents have higher rates of some of the underlying health conditions that place people at greater risk of severe coronavirus cases. Among the five boroughs, the Bronx has by far the highest rates of diabetes and asthma emergency department visits (16% and 242.9 per 10,000 people, respectively). The Bronx was recently ranked last among the state’s counties in terms of health outcomes, as well as health factors including social, economic, and environmental factors and clinical care.
Table 3: NYC COVID-19 Deaths by Race and Ethnicity (as of April 6, 2020)
|
|
|
Latino: Black, African American |
Latino: White |
Latino: Asian |
Latino: Other |
Race/Ethnicity |
|
Number of Deaths |
521 |
428 |
424 |
112 |
70 |
917 |
|
% of Total with |
33.5 |
27.5 |
27.3 |
7.2 |
4.5 |
* |
|
Population |
2,449,450 |
1,849,077 |
2,694,258 |
1,231,790 |
174,173 |
* |
|
Crude Death Rate |
21.3 |
23.1 |
15.7 |
9.1 |
40.2 |
* |
|
Age-Adjusted Death Rate |
22.8 |
19.8 |
10.2 |
8.4 |
59.5 |
* |
Source: New York City Department of Health
COVID-19 mortality rates are higher among the city’s Hispanic, Black, and non-Hispanic/Latino: Other populations.
The age-adjusted COVID-19 death rate is particularly high among the non-Hispanic/Latino: Other population at 59.5 per 100,000 people.The mortality rate among New York City’s Hispanic and Black population is also comparatively high, reaching 22.8 and 19.8, respectively. White and Asian populations have the lowest death rates due to COVID-19 (10.2 and 8.4, respectively). It should be noted that data on race and ethnicity is only complete for 63 percent of deaths; rates based on incomplete data may not be representative of the true distribution of deaths in New York City.