State of the City 2019
In this section we provide insight into New York City’s rental market and describe the continued challenges that New York City renters face when searching for housing affordable to their household. While in recent years, median renter income increased more than median gross rent, the gap between renter income and rent still exceeds pre-recession rates. Renters in search of affordable housing, particularly low- and moderate-income households, face extremely limited choices. Finally, while the overall number of homeless families recently dropped, it remained above 40,000 for the seventh year in a row, and the number of homeless single adults rose by 6.7 percent in 2019.
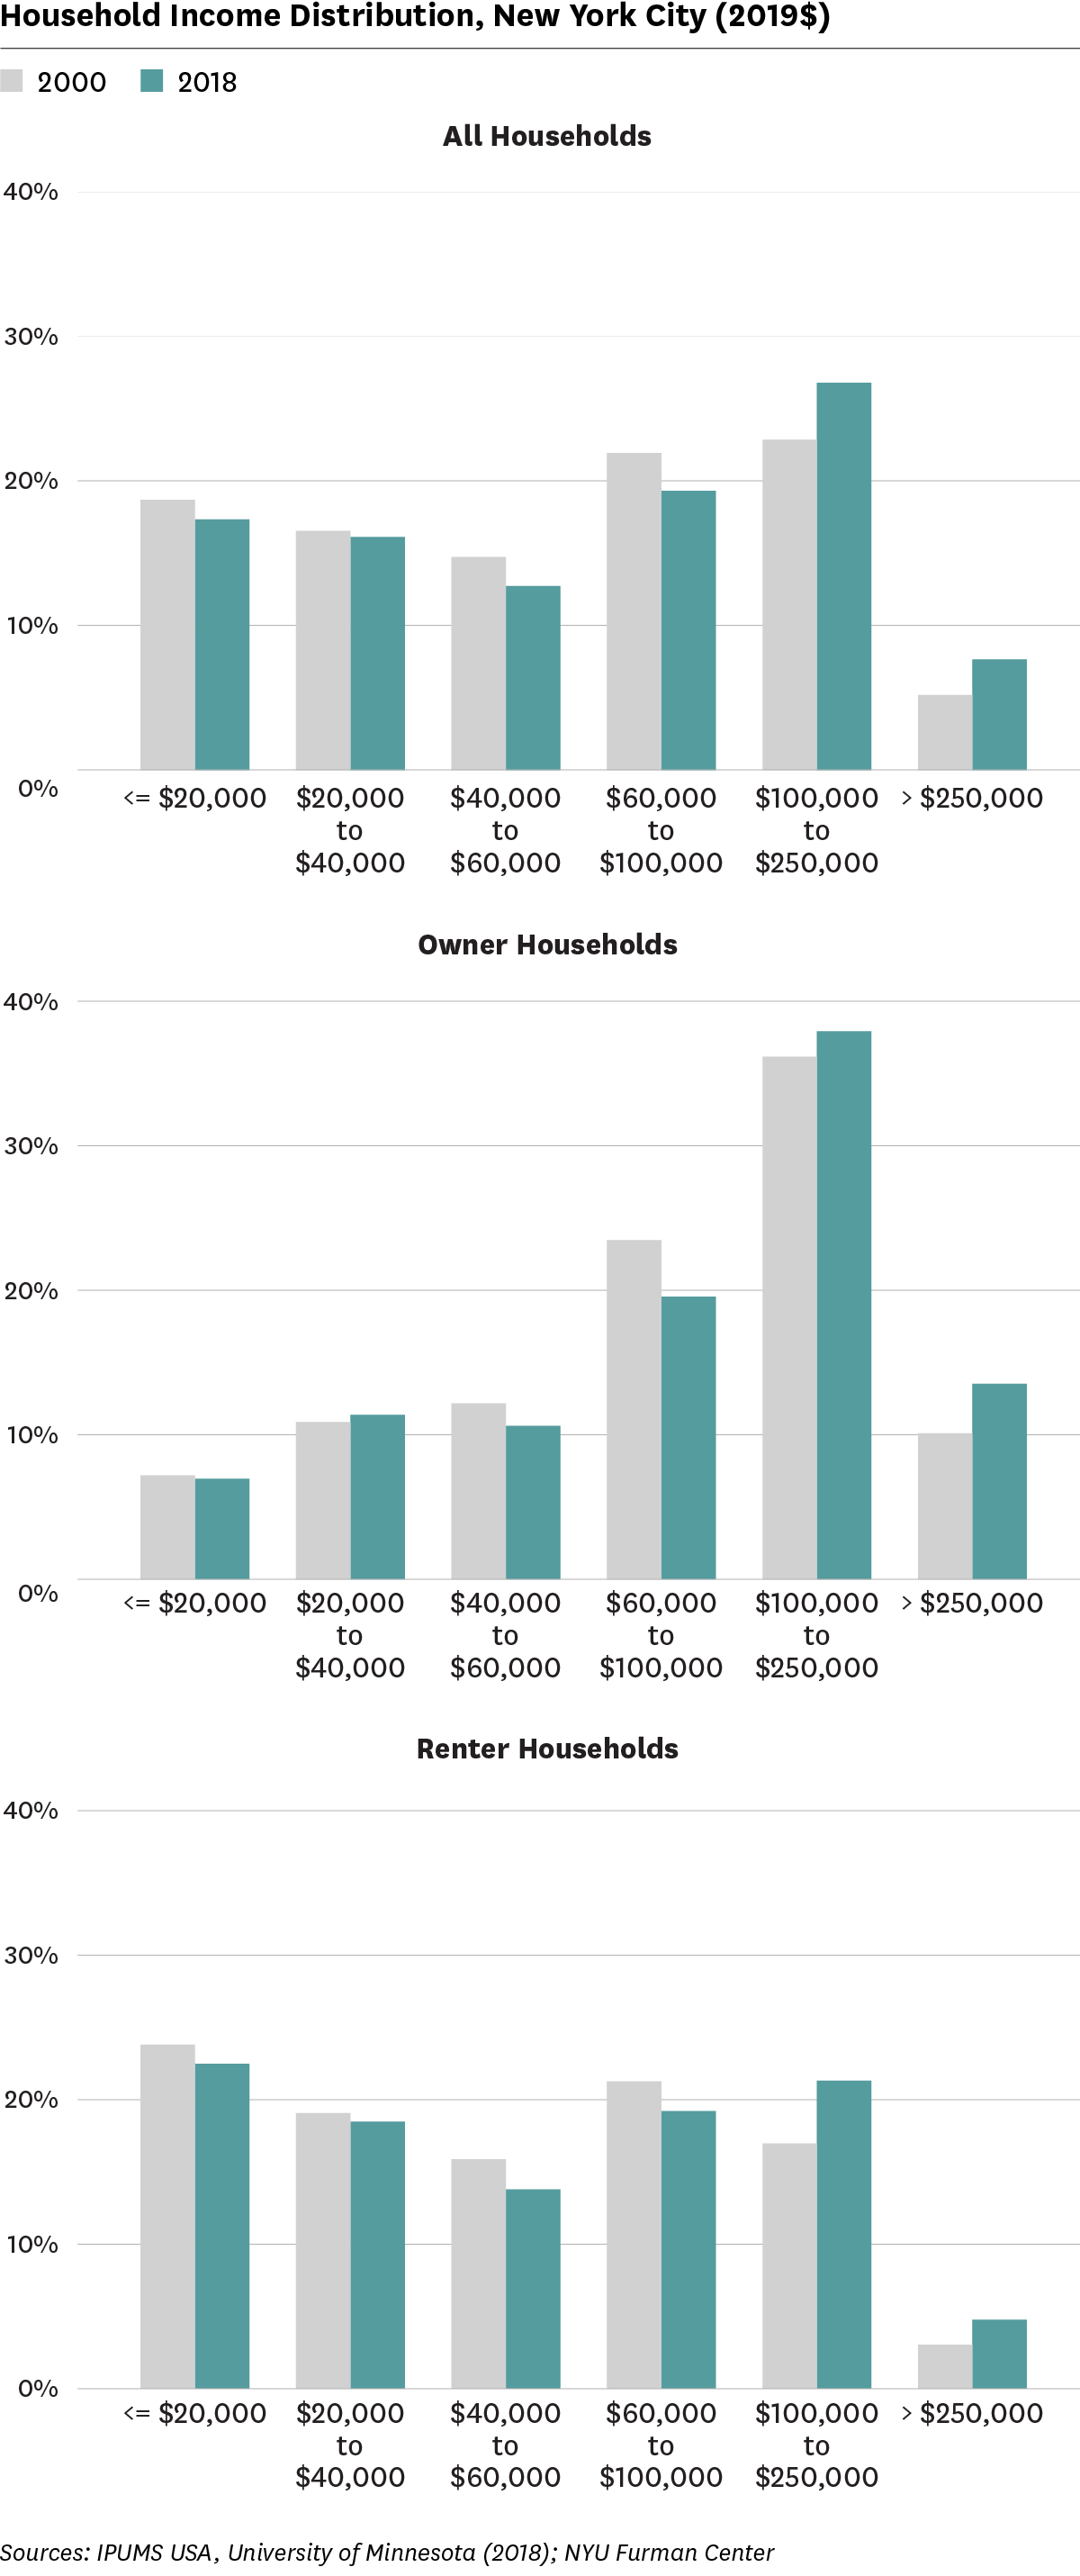
Between 2000 and 2018, renter households earning less than $100,000 made up less of the overall renter population, while renters with earnings above $100,000 made up more of the renter population.
Overall, the median household annual income rose between 2000 and 2018. Median renter income grew to $50,349 (+/-$725) in 2018, up $2,334 (+/-$1,443) from 2017. Increasing renter incomes could reflect wage growth among residents, but it could also reflect a change in the composition of the renter population, with more affluent households moving to the city and/or choosing to rent instead of purchasing homes. The share of all households with earnings between $100,000 and $250,000 rose significantly by 3.9 percentage points and the share of all households earning above $250,000 also increased significantly. Conversely, the share of all households earning less than $100,000 decreased significantly. Compared to all households, owner and renter households saw similar shifts in the distribution of income, except that there was no significant change in the share of owner households earning $40,000 or less.
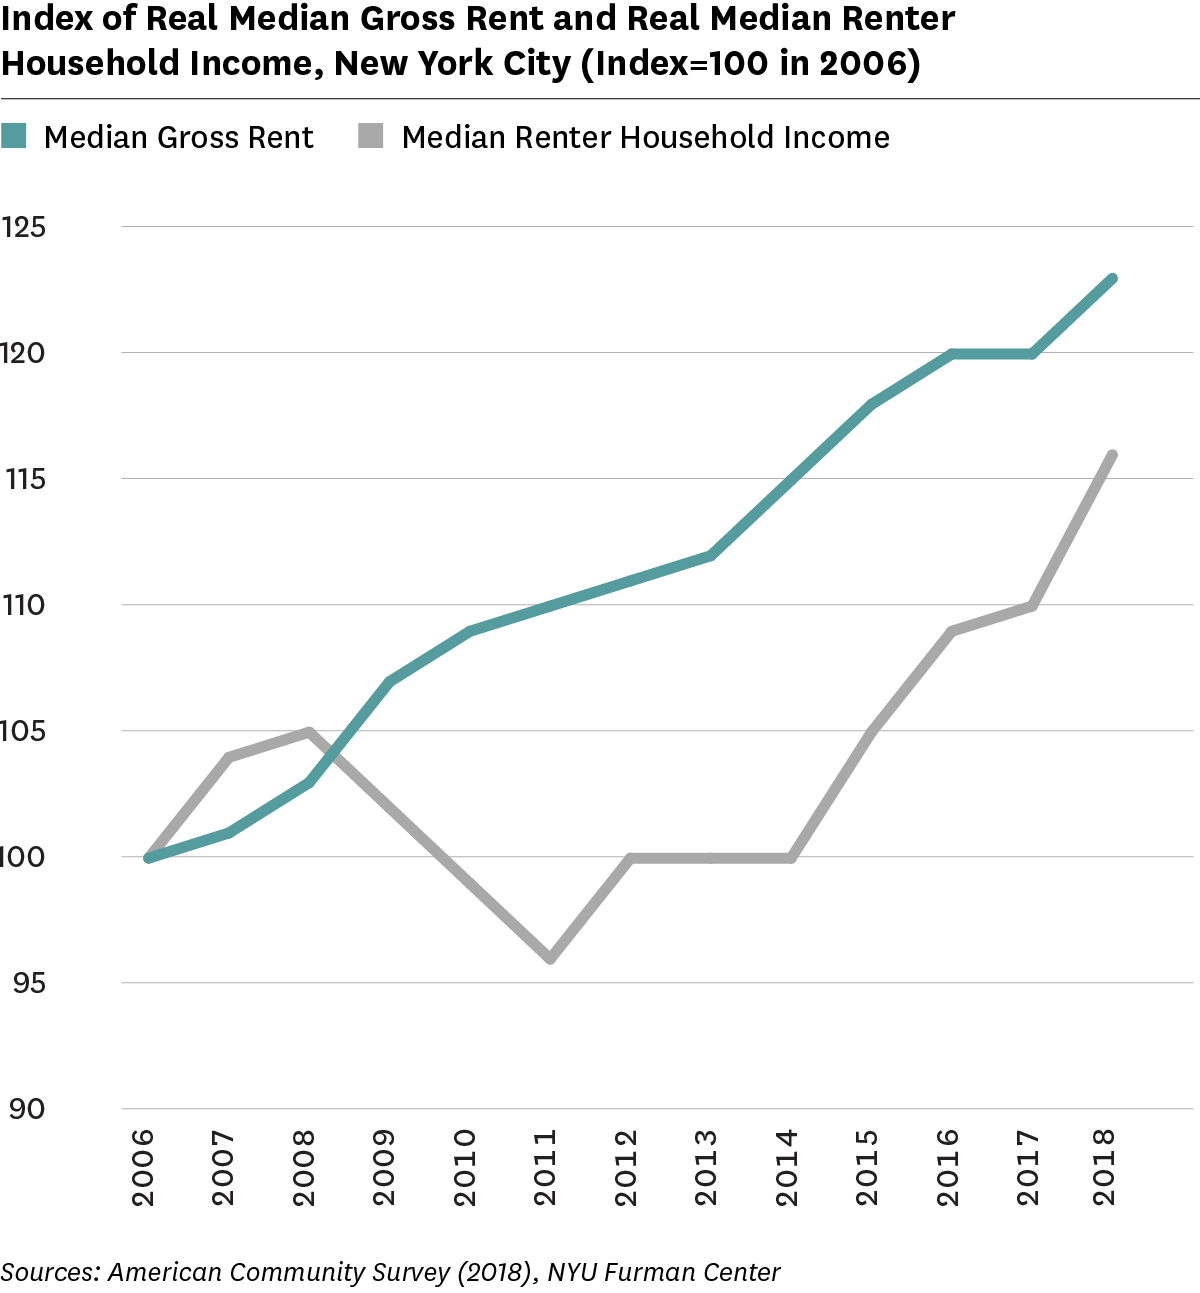
The gap between median renter income and median rent narrowed in the past year, continuing a trend that began in 2015.
In each year since 2015 median renter income grew at a faster rate than median rent. Between 2017 and 2018, median renter income grew at 5.4 percent while median rent rose by 3.2 percent. However, looking over the full period between 2006 through 2018, rent growth still surpassed income growth, due to the large decline in real renter incomes between 2008 and 2011.
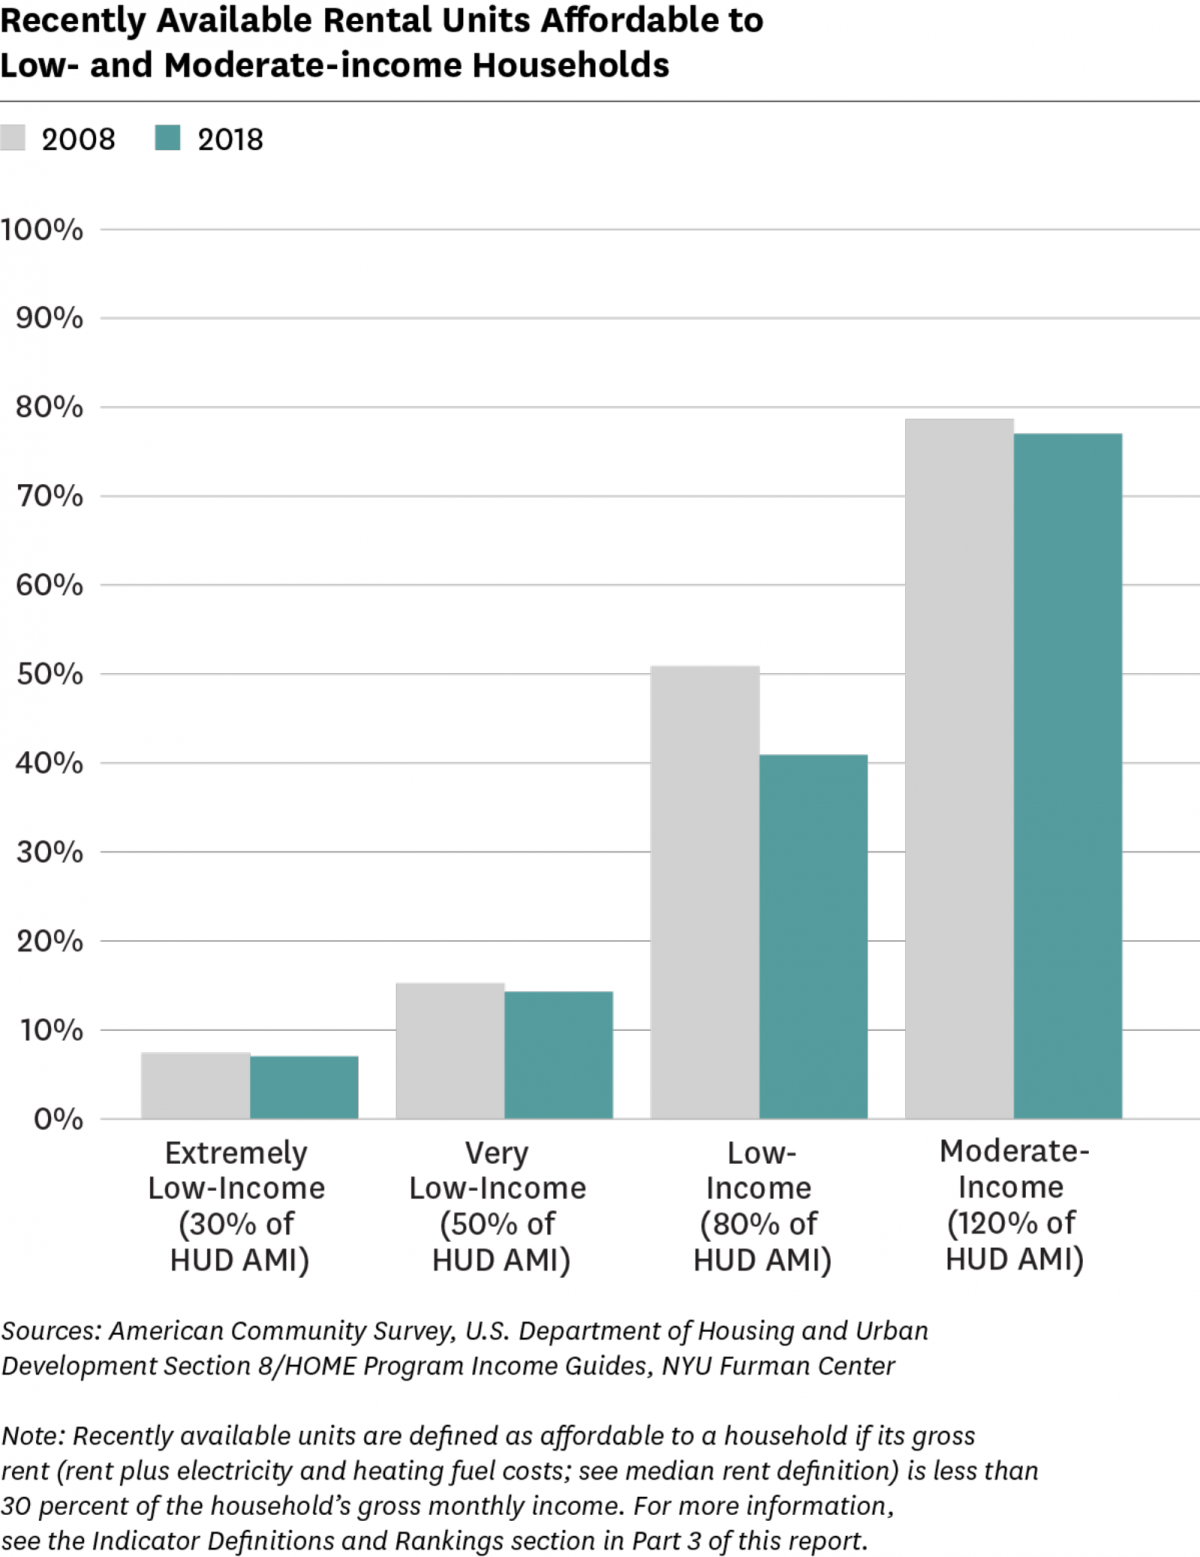
The share of recently available rental units affordable to low- and moderate-income households declined over the past decade.
Between 2008 and 2018, the share of recently available rental units affordable to households earning 80% of Area Median Income (AMI) dropped significantly, from 50.9 percent to 40.9 percent. The share of recently available rental units affordable to households earning 120% of AMI fell more modestly, dropping from 78.6 percent in 2008 to 77.0 percent of units in 2018. There was little change in the share of rental units affordable to households earning 50% of AMI or less, but they continued to face a severe shortage of units. In 2018, only 14.3 percent of available rental units were affordable to households earning 50% of AMI, and 7.0 percent of available rental units were affordable to households earning 30% of AMI.
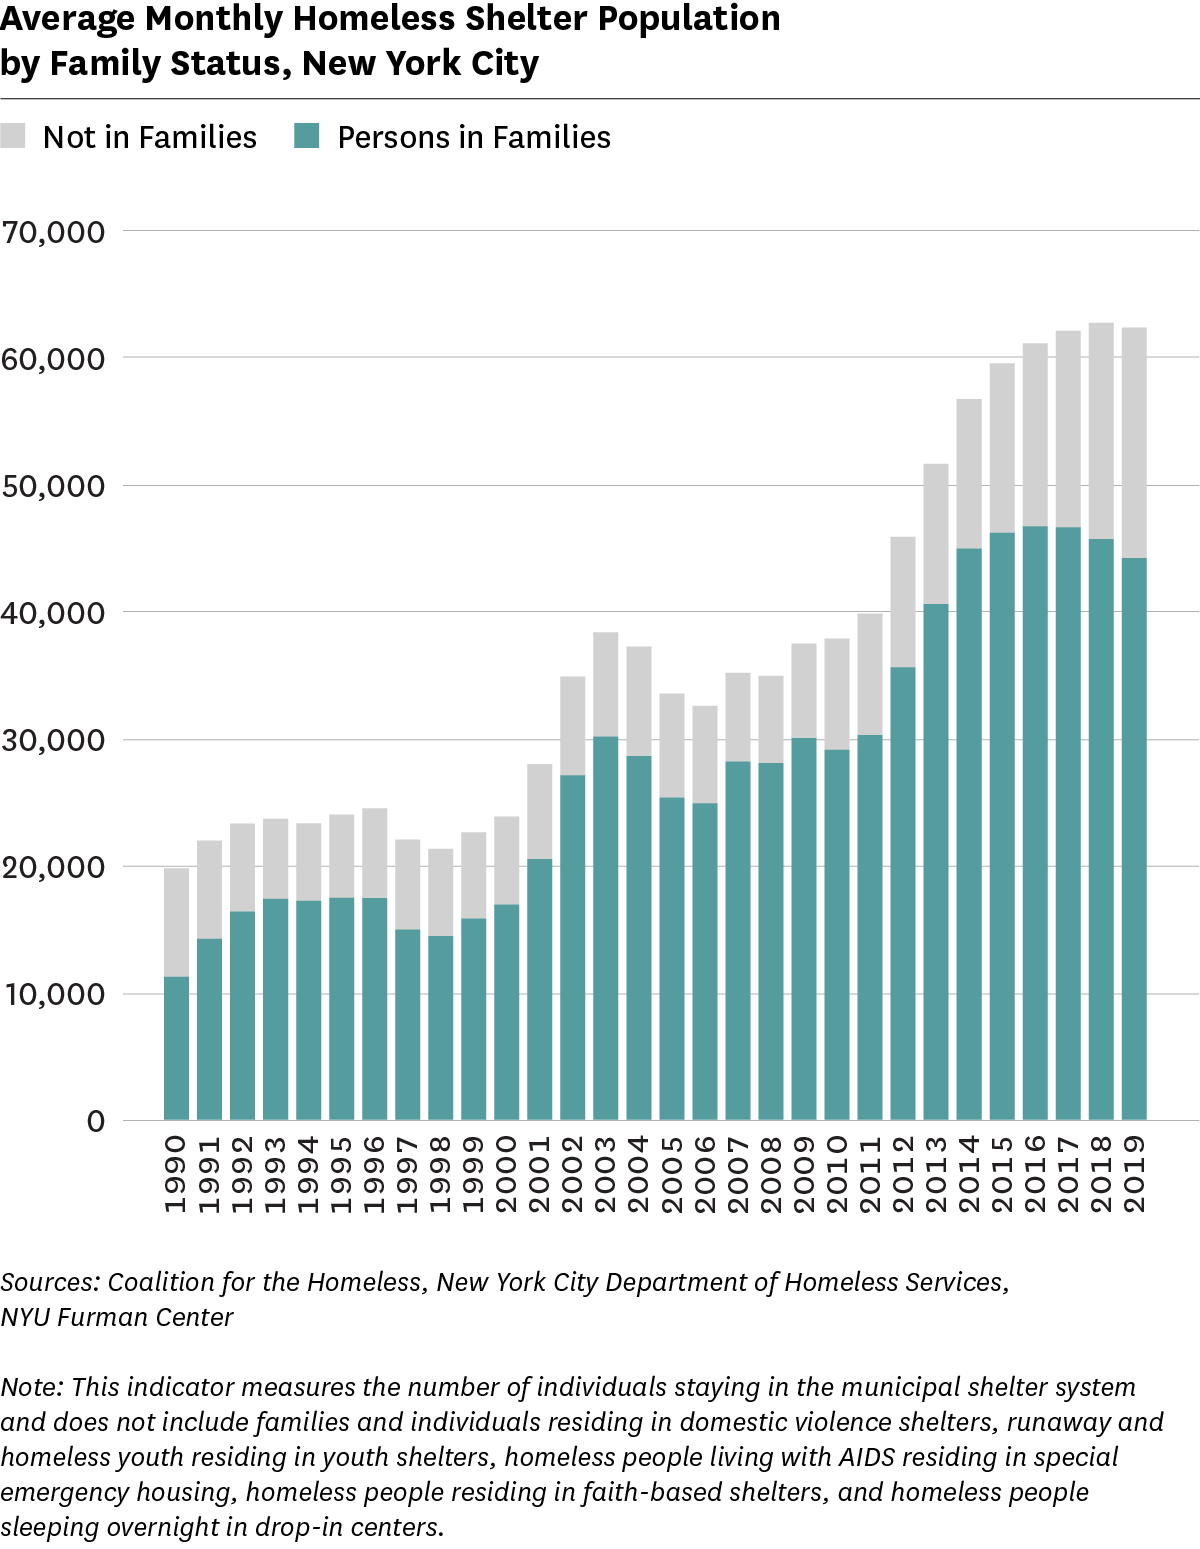
The overall number of people living in homeless shelters decreased modestly by 0.6 percent between 2018 and 2019, but the number of single adults increased.
During the past decade the number of people staying in shelter swelled: between 2009 and 2019, the number of people in families living in shelter increased by 47.2 percent, while the number of single adults living in shelters grew by 144.2 percent. The average monthly count of people in families living in shelters peaked in 2016, but then decreased by 5.4 percent between 2016 and 2019. Between 2018 and 2019, the average monthly count of people in shelters stayed relatively constant at 62,670 in 2018 and 62,297 in 2019. However, recent trends differ by family status. Between 2018 and 2019, the number of homeless persons in families decreased by 3.3 percent, while the number of homeless single adults increased by 6.7 percent.
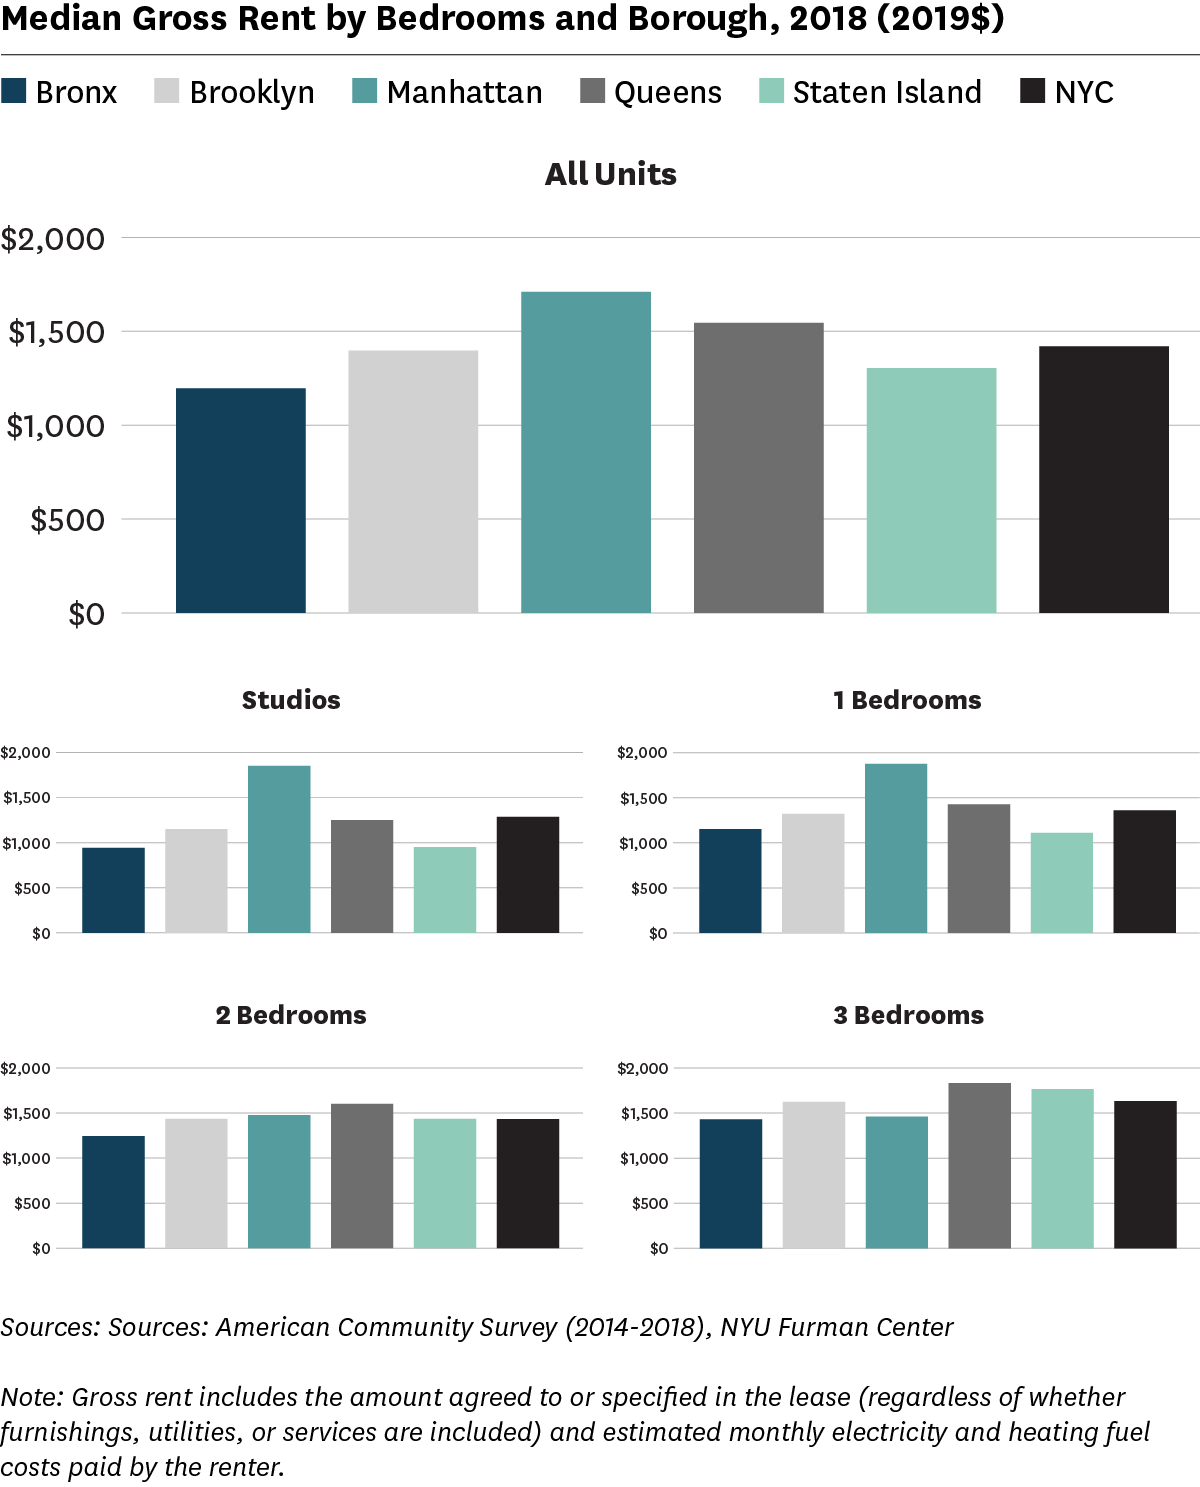
Rent levels varied across the city, with the lowest rents in the Bronx and the highest rents in Manhattan.
Gross rent—or the rent specified in a lease (whether or not furnishings, utilities, and services are included) in addition to the estimated monthly electricity and heating costs paid by the tenant—provides insight into housing and utility costs for renters across the city. Manhattan remained the most expensive borough for all sizes of units (median gross rent $1,710) followed by Queens ($1,545), Brooklyn ($1,397), Staten Island ($1,303), and the Bronx ($1,195). Across the city, the median gross rent for all rental units is $1,419. The median rents in Manhattan for two- and three-bedroom apartments were significantly lower than the rents for studios and one-bedroom units, likely due to the fact that newer, market-rate units in Manhattan tend to be studio or one-bedroom apartments, while larger units were disproportionately located in public housing and other subsidized housing.
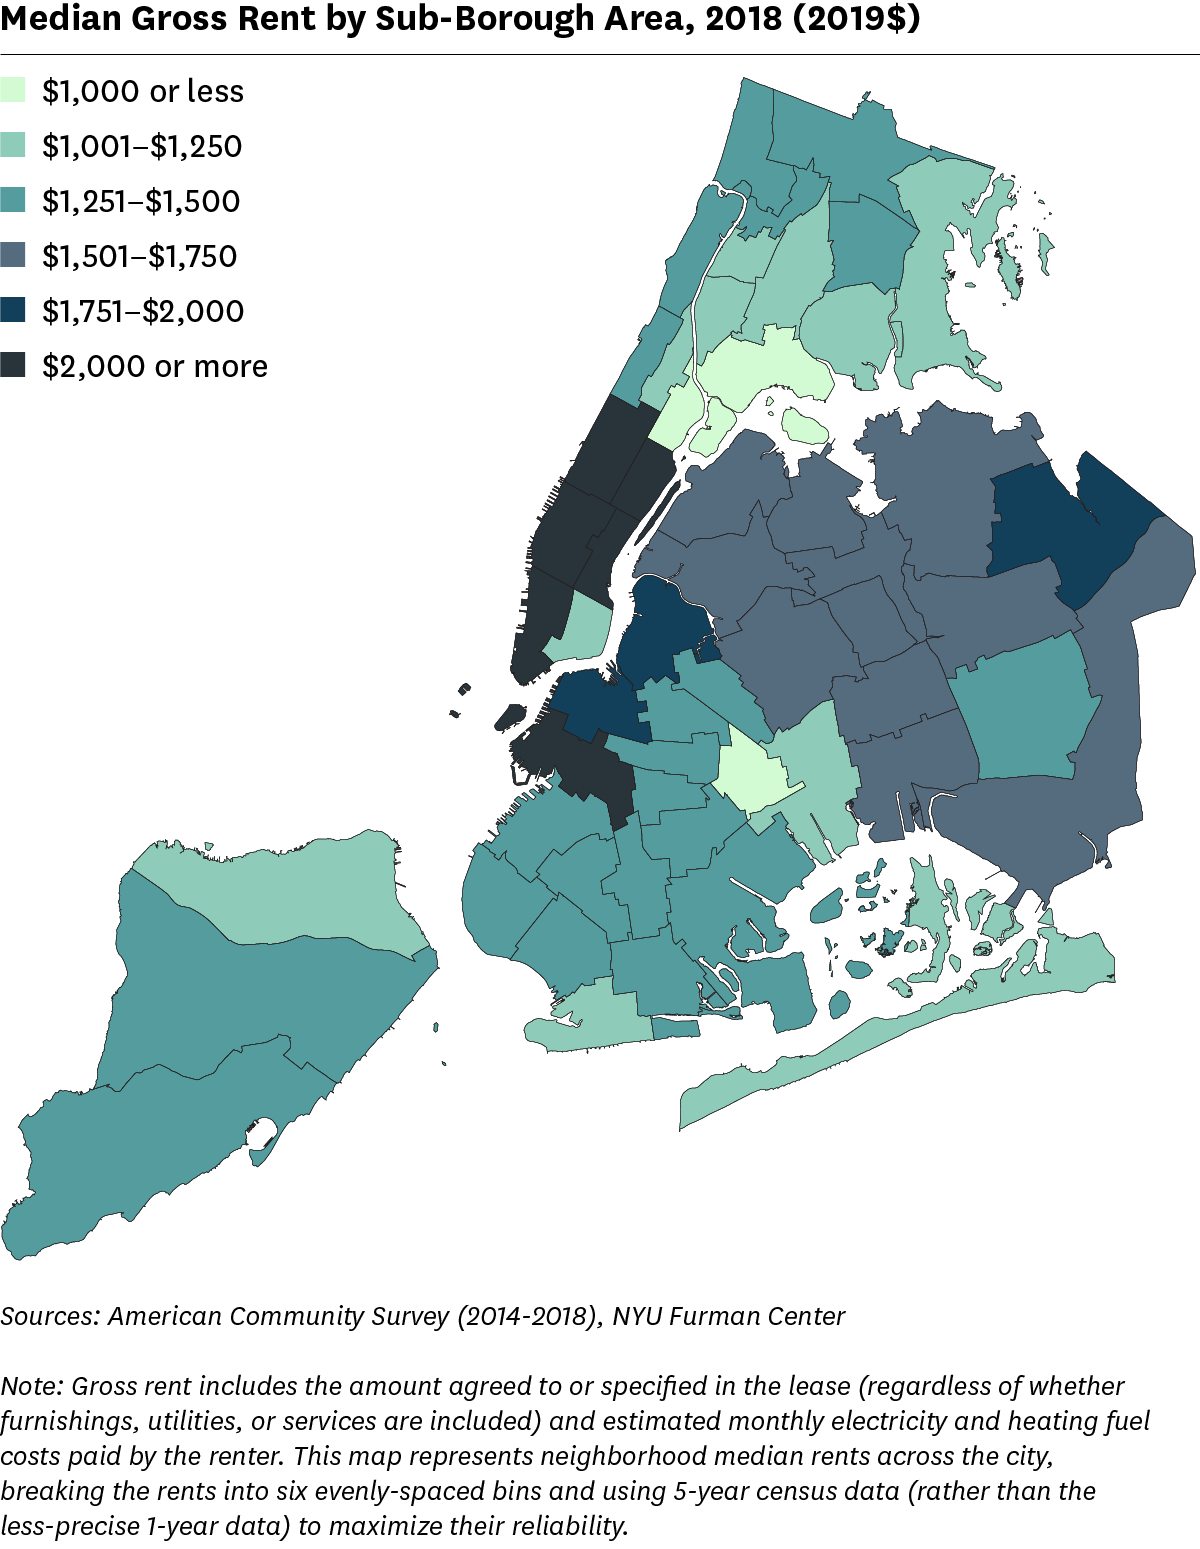
There are only three Sub-Borough Areas with a median rent below $1,000 per month.
Of fifty-nine Sub-Borough Areas, just three have median rents below $1,000 per month. Six Sub-Borough Areas have median rents at or above $2,000 per month. Neighborhoods in Manhattan and Downtown Brooklyn have the highest median rents citywide. In total, six neighborhoods have median rents at or above $2,000; Manhattan’s Greenwich Village/Financial District neighborhood is the most expensive in the city, with a median gross rent of $2,734. The Lower East Side/Chinatown is lower Manhattan’s only area with median rent below $2,000 per month, most likely due to the neighborhood’s high concentration of public housing, subsidized housing, and older, rent-regulated apartments. Three neighborhoods have median rents below $1,000: East Harlem in Manhattan, Mott Haven/Hunts Point in the Bronx, and Brownsville/Ocean Hill in Brooklyn.
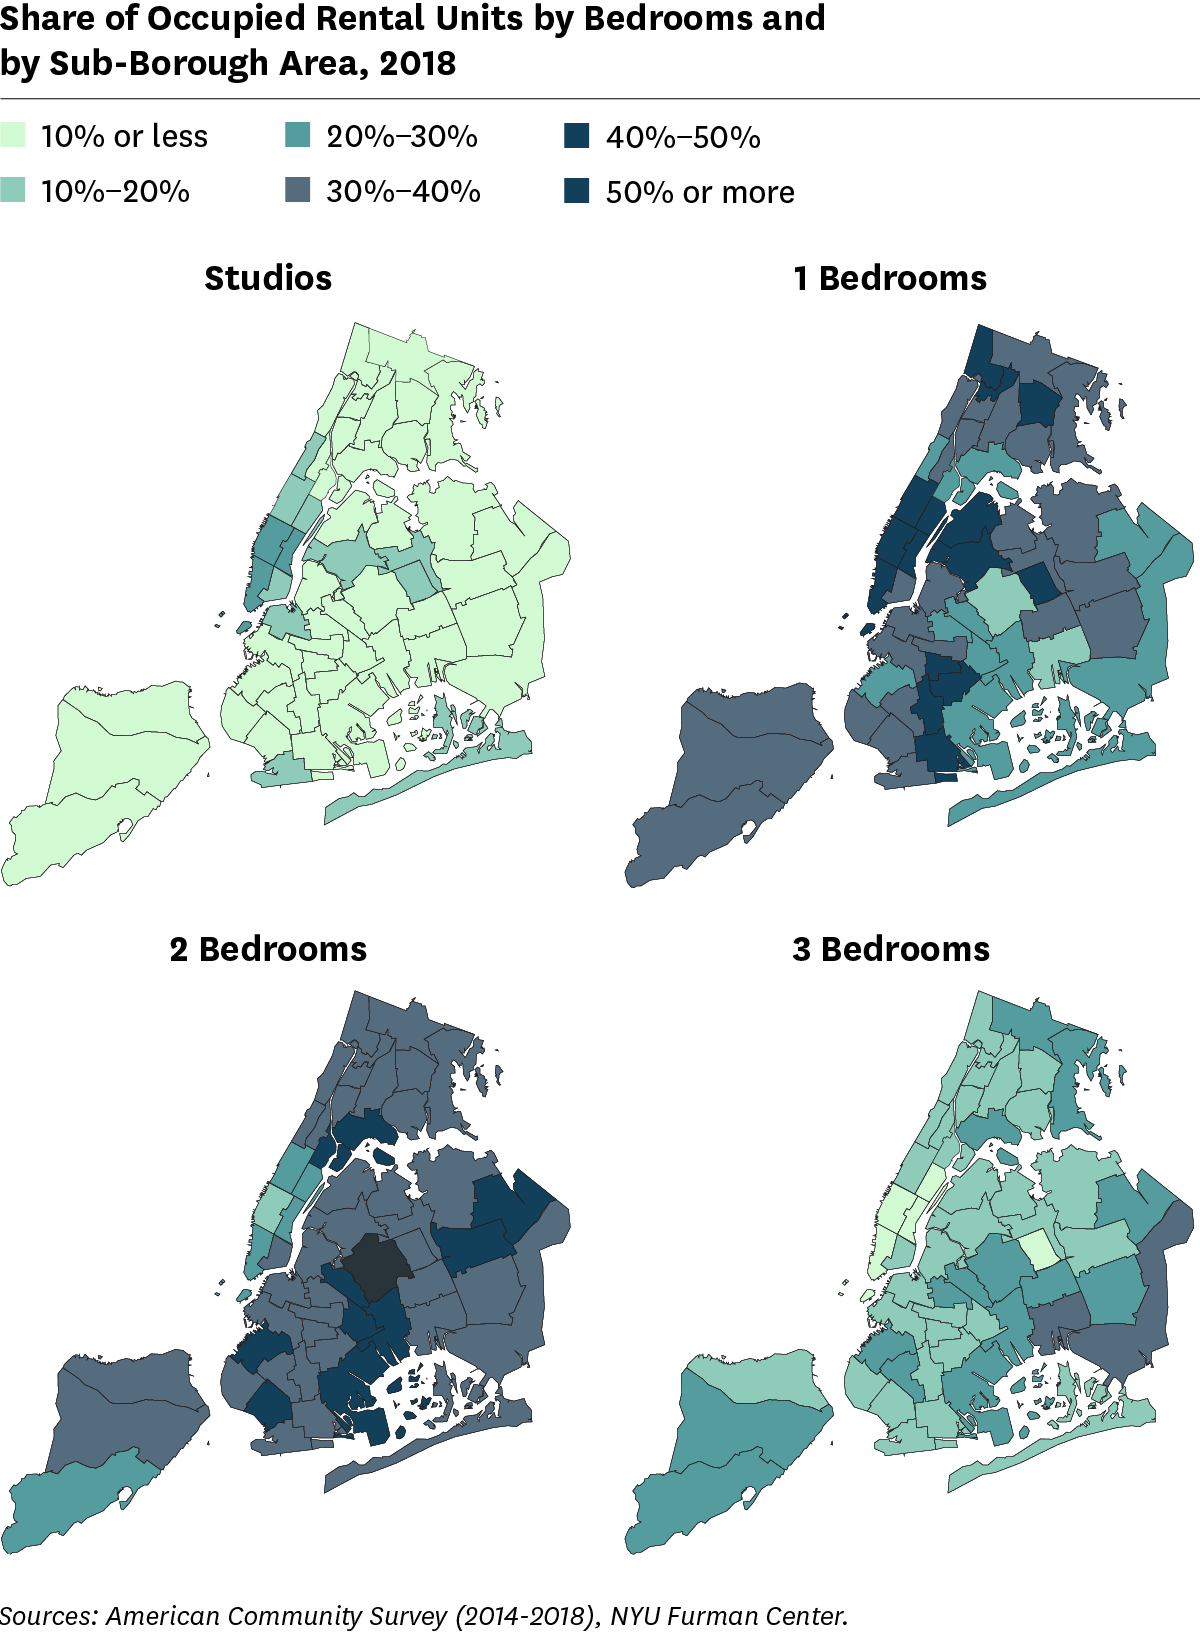
On average, smaller rental units were typically located in more central and expensive neighborhoods, while larger units were further from the city center.
When reviewing the distribution of units across the city, a clear pattern emerges—studios and one-bedroom units were more prevalent in areas nearest central business districts, while two- and three-bedroom units were more likely to be found in the outer boroughs. Studio units can provide lower cost housing for single adults or small families, yet they were mostly located in the city’s least affordable places; the neighborhood with the highest share of units that were studio and one-bedroom homes was Chelsea/Clinton/Midtown in Manhattan (26.6 percent and 48.0 percent, respectively). With the exception of certain parts of Manhattan, Queens, and Brooklyn, studios accounted for 10 percent or less of occupied units. One-bedroom units were the most prevalent rental unit type across Manhattan, with the exception of East Harlem where two-bedroom units predominated. Two Queens neighborhoods had the highest share of units that were two-bedroom and three-bedroom homes: Middle Village/Ridgewood (50.8 percent); and Queens Village (35.1 percent). Two-bedroom units accounted for between 30 and 40 percent of occupied rental units for the majority of sub-borough areas in New York City.
All content © 2005 – 2024 Furman Center for Real Estate and Urban Policy | Top of page | Contact Us