State of the City 2021
In this section we describe trends which provide some context to New York City’s recovery from the pandemic. Although 2021 marked the conclusion of the first full year of the pandemic, the impact of COVID-19 remains persistent throughout New York City. COVID-19 related deaths declined in 2021, as did the city's unemployment rate. The sheltered homeless population decreased by 13 percent between 2020 and 2021, with a notable decline in the number of adults in families.
Similar to the section on the city’s housing stock, this section uses mostly administrative data to focus on topics directly related to COVID-19. All of the topics, with the exception of the income distribution, use data through all of 2021.
In 2020, the Census Bureau limited the release of the ACS 1-year data to experimental estimates rather than the standard data products. Due to these restrictions, we do not report on the 2020 ACS 1-year data in the income distribution and share of unemployed figures below, but instead repeat the figures using ACS data from last year (2019 being the most recent data).
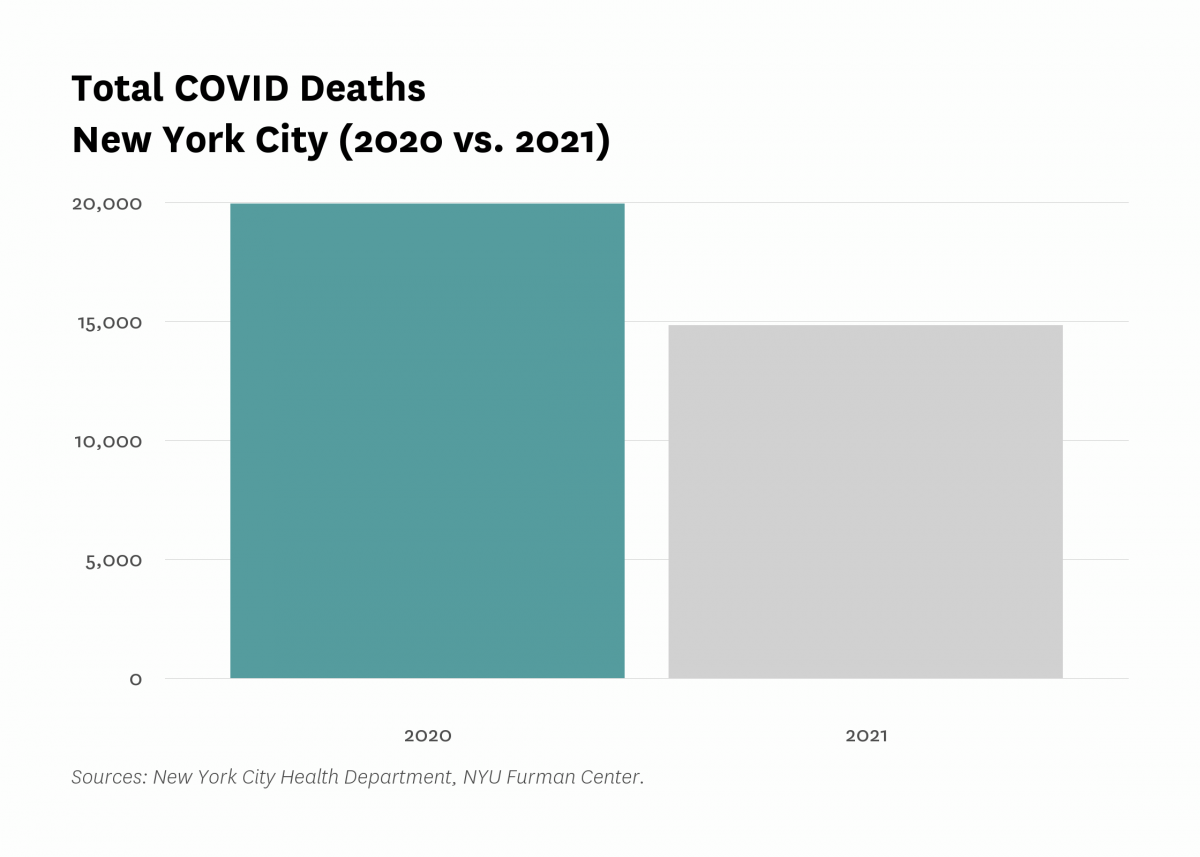
The number of COVID-related deaths in New York City declined by about 5,000 between 2020 and 2021.
Across New York City, the total number of COVID-related deaths decreased from 19,938 in 2020 to 14,826 in 2021. The decrease in COVID-related deaths can likely be attributed to various changes in pandemic conditions such as changes in medical treatments, hospital conditions, mask mandates, and the creation and dissemination of COVID-19 vaccines.
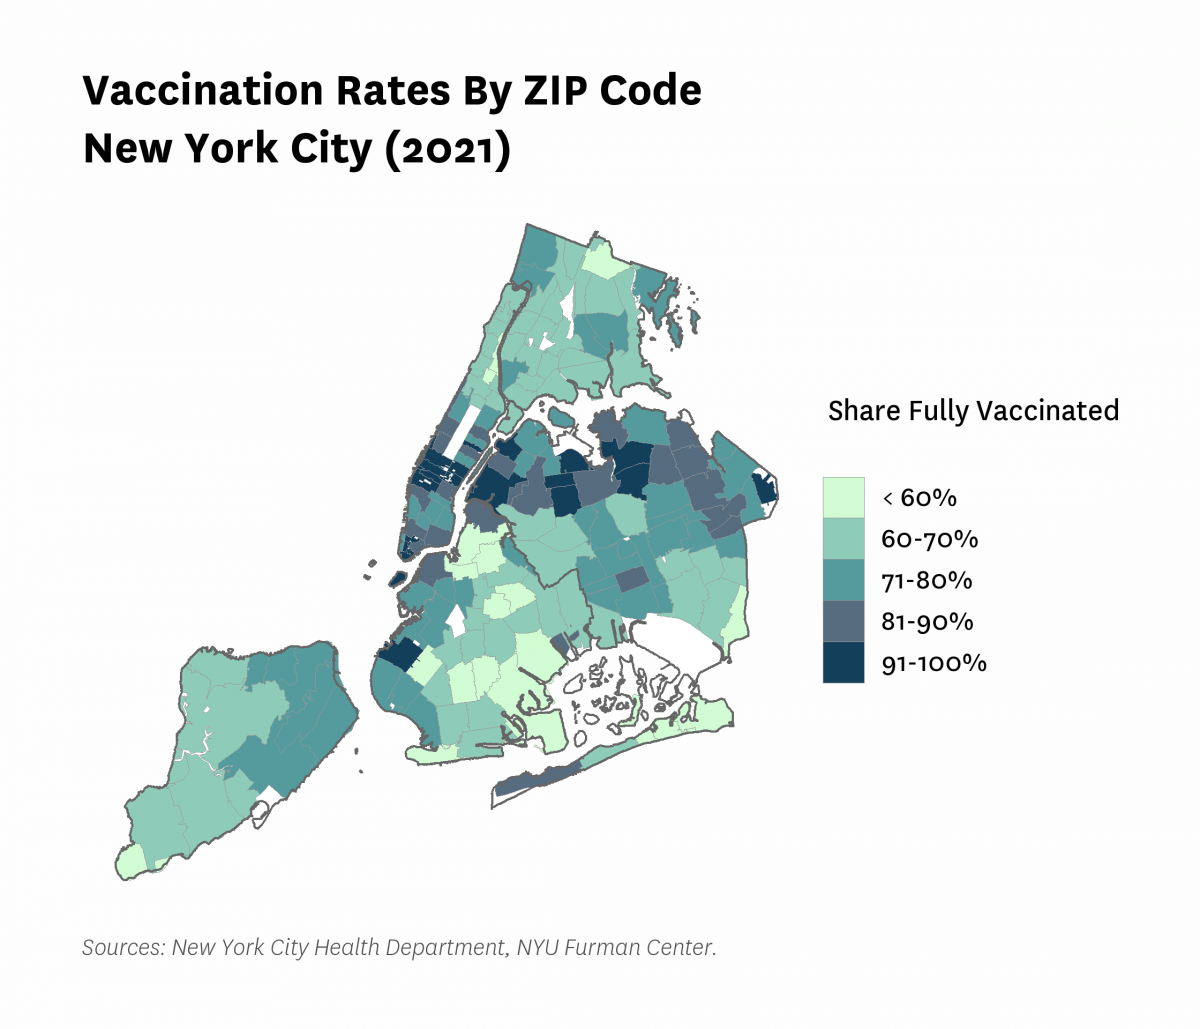
In 2021, midtown Manhattan and parts of Queens and Brooklyn saw some of the highest COVID-19 vaccination rates.
ZIP Codes in northern Queens, lower Manhattan, and northwest Brooklyn had particularly high shares of residents that were fully vaccinated. The Garment District in midtown Manhattan had the highest vaccination rate across the city with close to a 100 percent rate. The Financial and Theater Districts in Manhattan also had high vaccination rates, followed by the Garment District. Neighborhoods in the Bronx, southwest Brooklyn and some neighborhoods in Staten Island and Queens had lower vaccination rates relative to the rest of the city. The neighborhoods of Borough Park, Far Rockaway, and Brownsville/Ocean Hill had the lowest vaccination rates, at 48.6 percent, 48.8 percent, and 51.4 percent, respectively, as of the end of 2021.
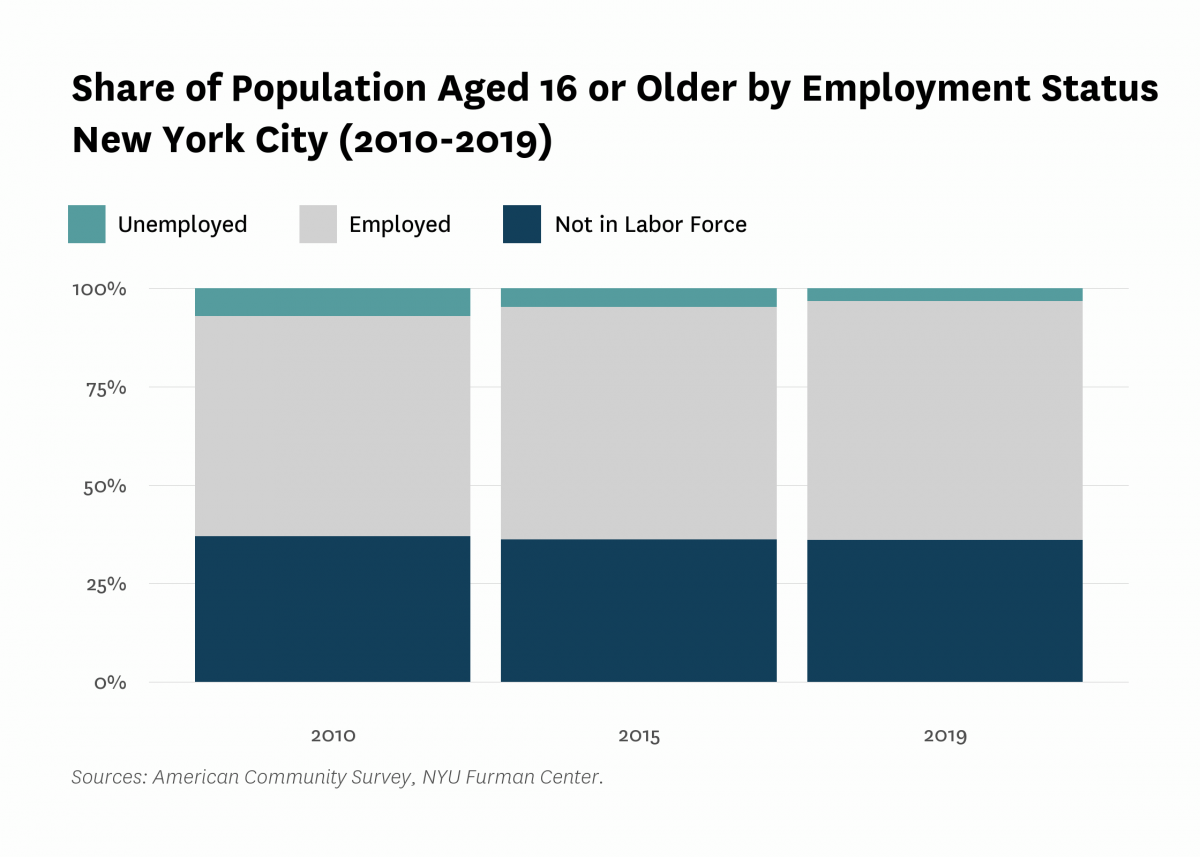
The share of unemployed New York City residents decreased between 2010 and 2019.
In 2019, 3.3 percent of New Yorkers aged 16 or older were unemployed, a decline of 1.4 percentage points from 2015 and 3.7 percentage points from 2010. According to 2019 ACS data, 60.7 percent of New Yorkers were employed in 2019, which was a 1.7 percentage point increase from 2015 and a 4.8 percentage point increase from 2010. The share of the population not in the labor force in 2019 was 36 percent, a decrease of 0.2 percentage points from 2015 and 1.1 percentage points from 2010.
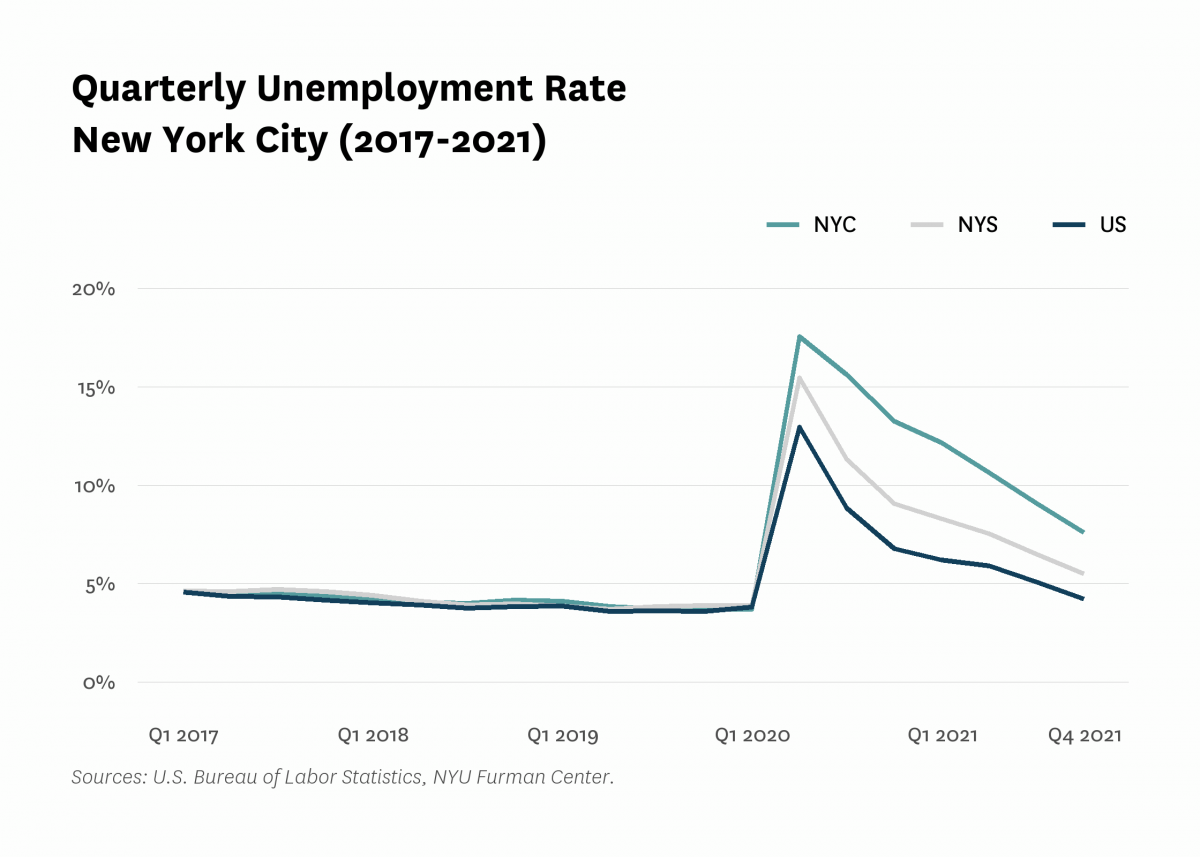
Unemployment decreased substantially between the second quarter of 2020 and the fourth quarter of 2021.
Data from the Department of Labor shows that between the second quarter of 2020 and the fourth quarter of 2021, the unemployment rate declined by 10.0 percentage points in New York City, 10.0 percentage points in New York State, and 8.7 percentage points in the United States. While both the city and state began this period with unemployment rates higher than the national average, those gaps have been reduced as their unemployment rates dropped more quickly. Still, the city ended the year with a higher unemployment rate than New York State or the country (7.6%, 5.5%, and 4.2%, respectively), even though they had experienced similar unemployment rates prior to the pandemic.
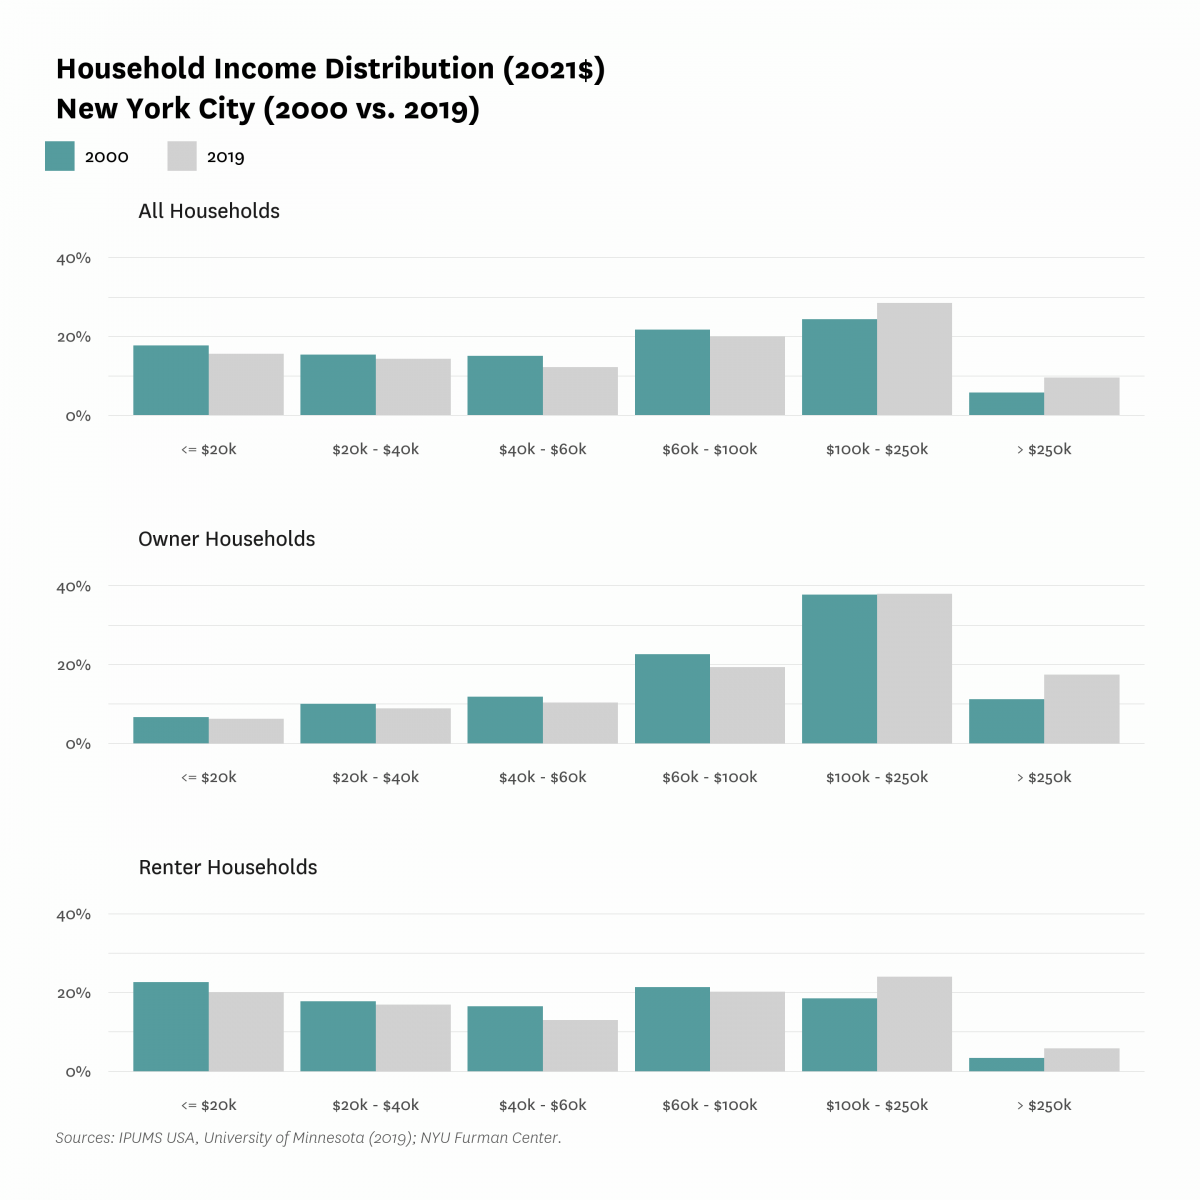
Between 2000 and 2019, the share of renter and owner households with annual household incomes exceeding $100,000 increased.
The share of all households with earnings between $100,000 and $250,000 increased by 4.1 percentage points between 2000 and 2019, with the share of all households earning more than $250,000 also increasing at a similar rate (3.8%). During the period between 2000 and 2019, both renter and owner households experienced similar income distribution shifts, but the most notable changes were the 6.3 percentage point increase in the share of owner households earning more than $250,000, and the 5.5 percentage point increase in the share of renter households earning between $100,000 and $250,000. On the other end of the income spectrum, the share of renter households who earned less than $20,000 decreased by 2.6 percentage points between 2000 and 2019.
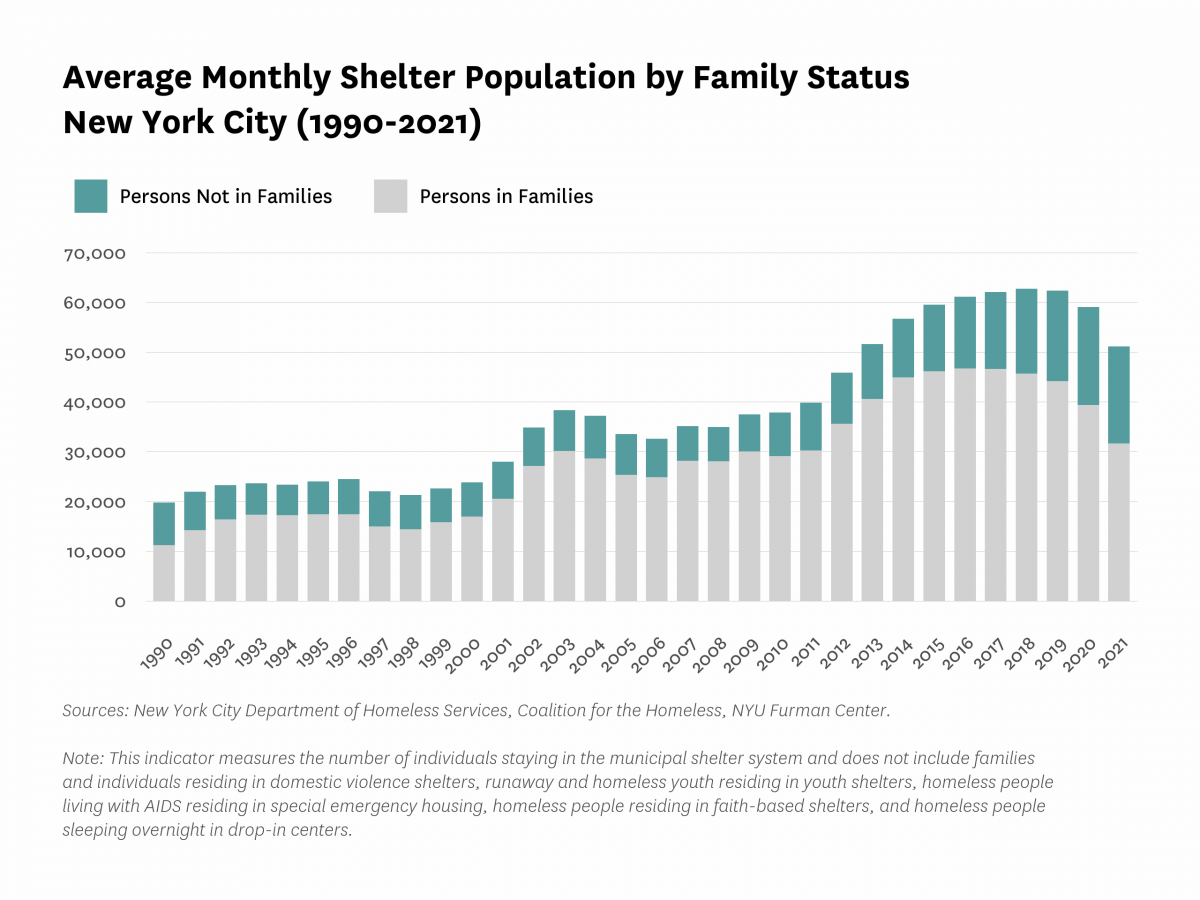
In 2021, the overall number of people who lived in homeless shelters decreased. This decline included single adults in homeless shelters, which had recently peaked in 2020.
The total homeless shelter population declined by about 13 percent between 2020 and 2021, from 59,006 to 51,090. The overall decline was driven by a 19.7 percent decrease in the number of families who lived in homeless shelters. The number of single adults decreased by about 1 percent from 2020, the year of the largest single adult population since data was made available in 1990. It is important to note that the data from the New York City Department of Homeless Services only accounts for the sheltered homeless population, which does not capture the total number of individuals experiencing homelessness.
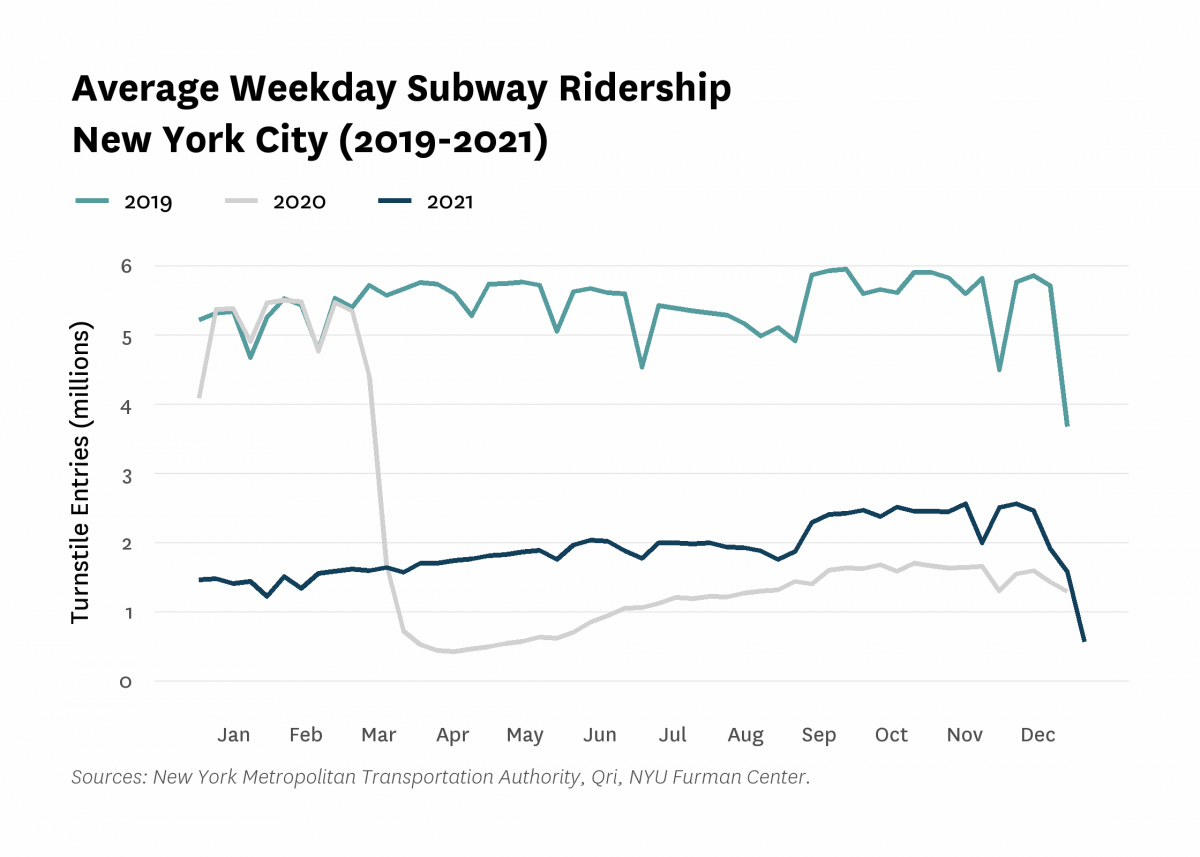
Average weekday subway ridership increased in 2021, after a decline in 2020 following the onset of the pandemic.
Weekday subway ridership in 2021 showed a notable increase compared to ridership after the start of the pandemic in March 2020. Ridership in 2021 from March onwards remained higher than the 2020 pandemic numbers, but had not yet climbed back to pre-pandemic levels. Changes in ridership patterns can likely be attributed to increases in New Yorkers working from home as well as the impact of New Yorkers who moved out of the city during the pandemic.
Ridership at the start of the pandemic and economic shutdown reached a low of about 430,000 entries in April 2020, which bears a stark contrast to 5.7 million entries in April 2019.
All content © 2005 – 2024 Furman Center for Real Estate and Urban Policy | Top of page | Contact Us