State of the City 2019
The data describing homeownership in New York City underscore the stark differences in homeownership by race and borough. In 2018 (the most recent year of data available), a significantly smaller proportion of Black and Hispanic households owned homes than white and Asian households. Reviewing home purchase mortgage originations between 2004 and 2018, the Black and Hispanic share of borrowers fell, while the share of borrowers who are Asian increased and the white share of borrowers stayed fairly stable. Fewer Black and Hispanic homeowners took advantage of low interest rates by refinancing their mortgages. Foreclosure rates varied widely across the city, with some neighborhoods in Brooklyn and Queens experiencing foreclosures up to 30 times more frequently than affluent areas in Manhattan. Recovery from the 2008 foreclosure crisis continues, but mortgage lending volumes remained significantly below pre- foreclosure crisis levels.
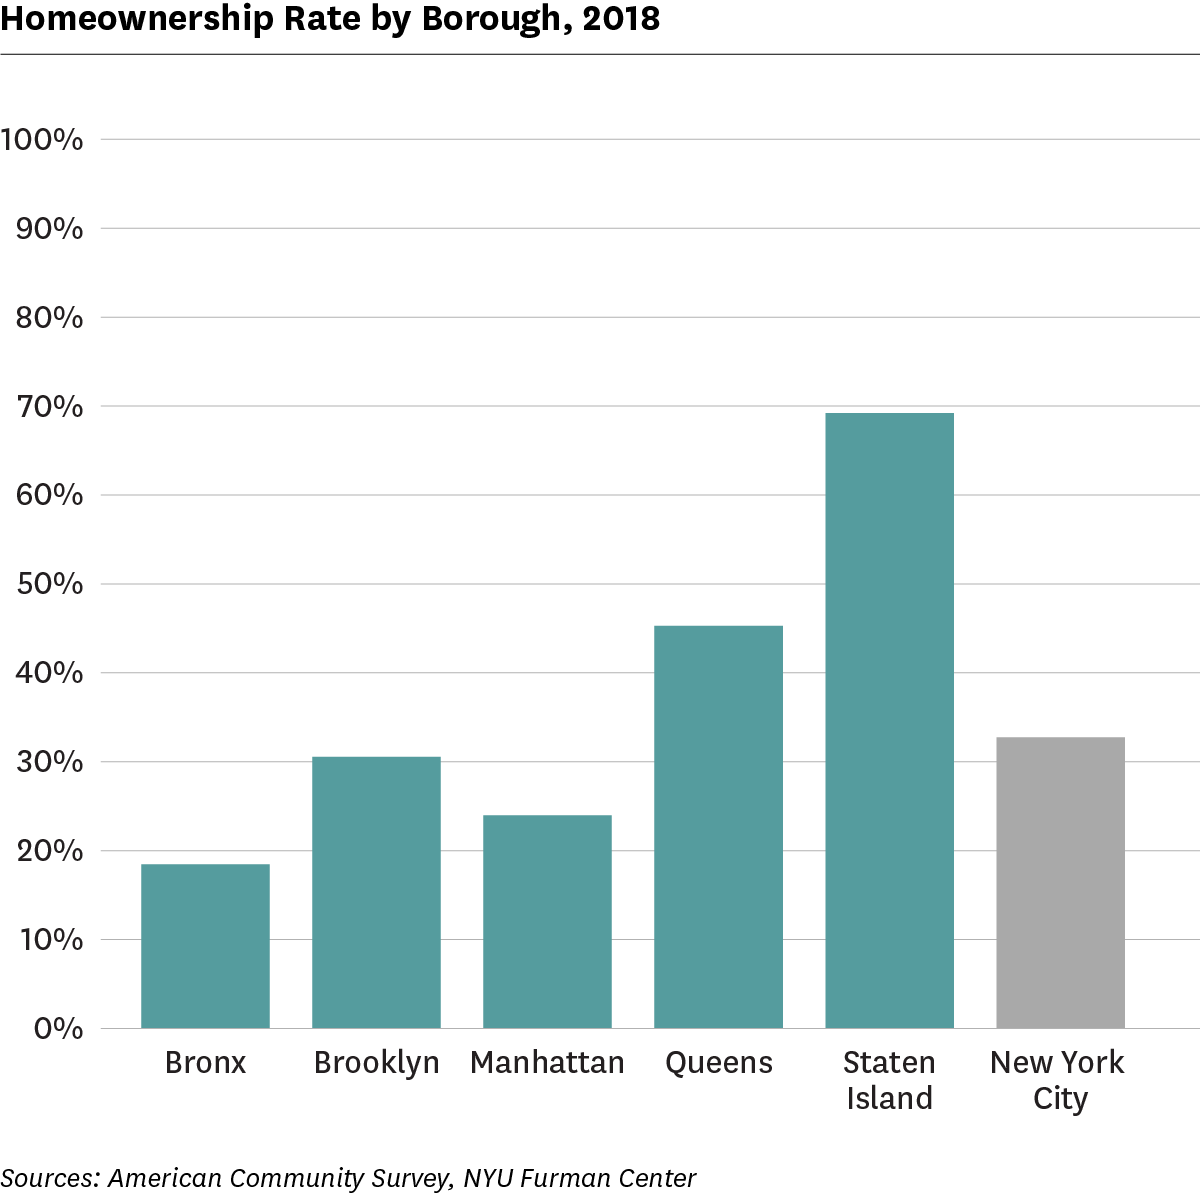
Homeownership rates are highest in Staten Island and lowest in the Bronx.
In 2018, the New York City homeownership rate was 33 percent, but it varied by borough. The homeownership rate in Staten Island was 69 percent, above the national rate (64%) and far higher than that in any other borough. The Bronx had the lowest homeownership rate at 18 percent, approximately 45 percentage points lower than the national rate. Queens had a homeownership rate of 45 percent, Brooklyn 31 percent, and Manhattan 24 percent.
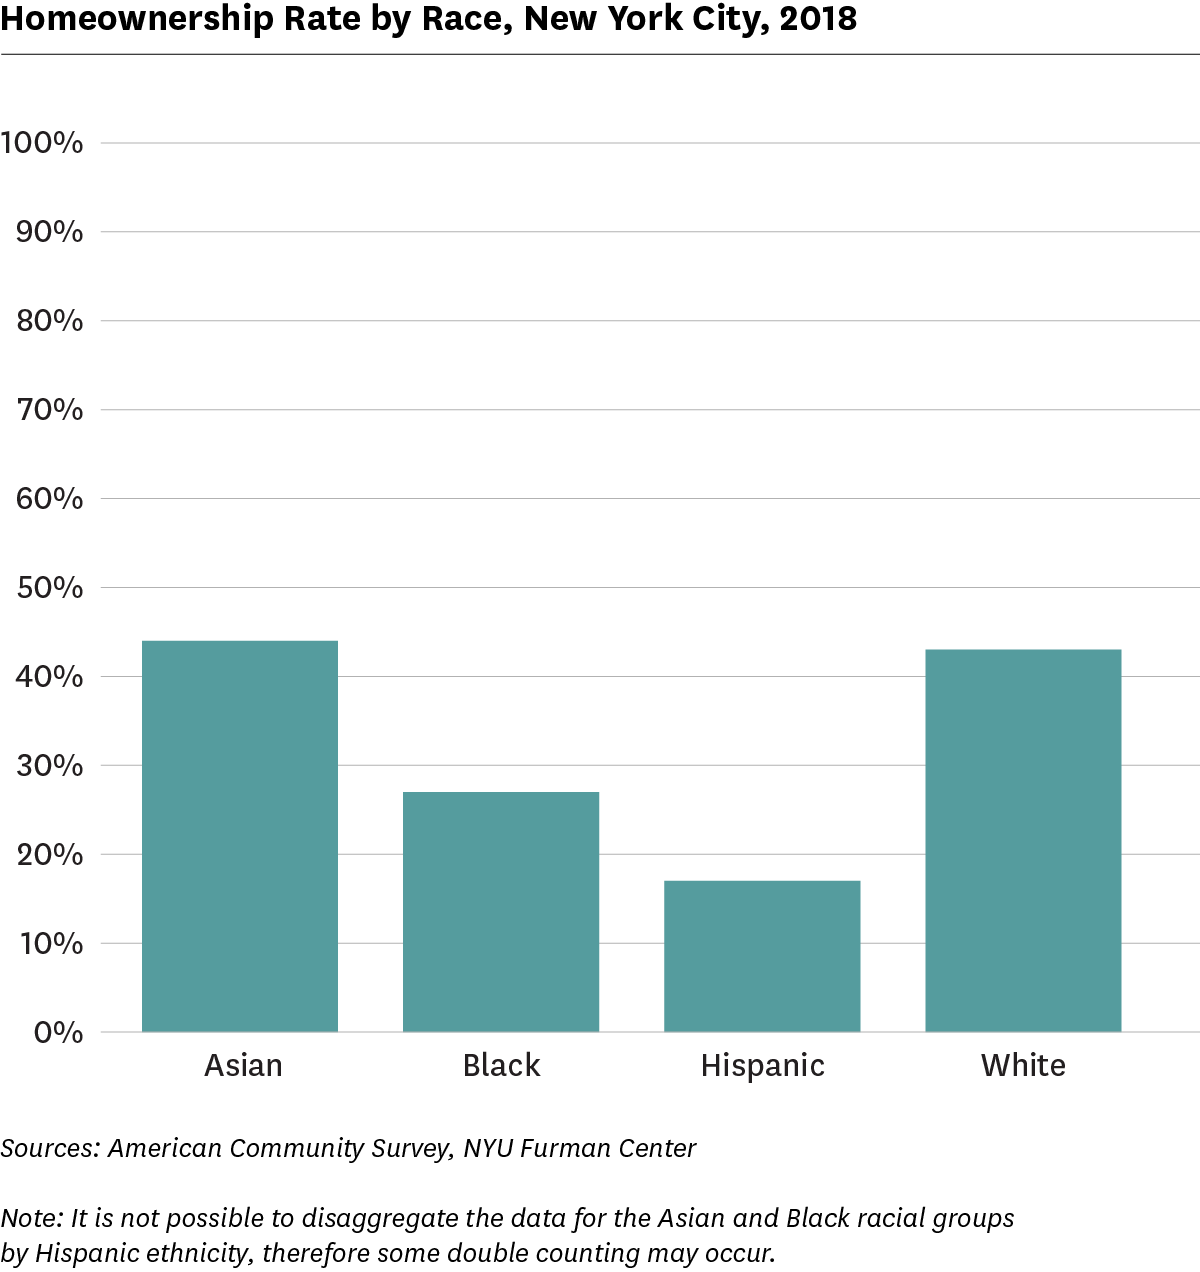
Homeownership rates for Black and Hispanic households were significantly lower than for white and Asian households.
Homeownership rates varied across racial lines. In 2018, while 44 percent of Asian households and 43 percent of white households owned their homes, only 27 percent and 17 percent of Black and Hispanic households owned their homes, respectively.
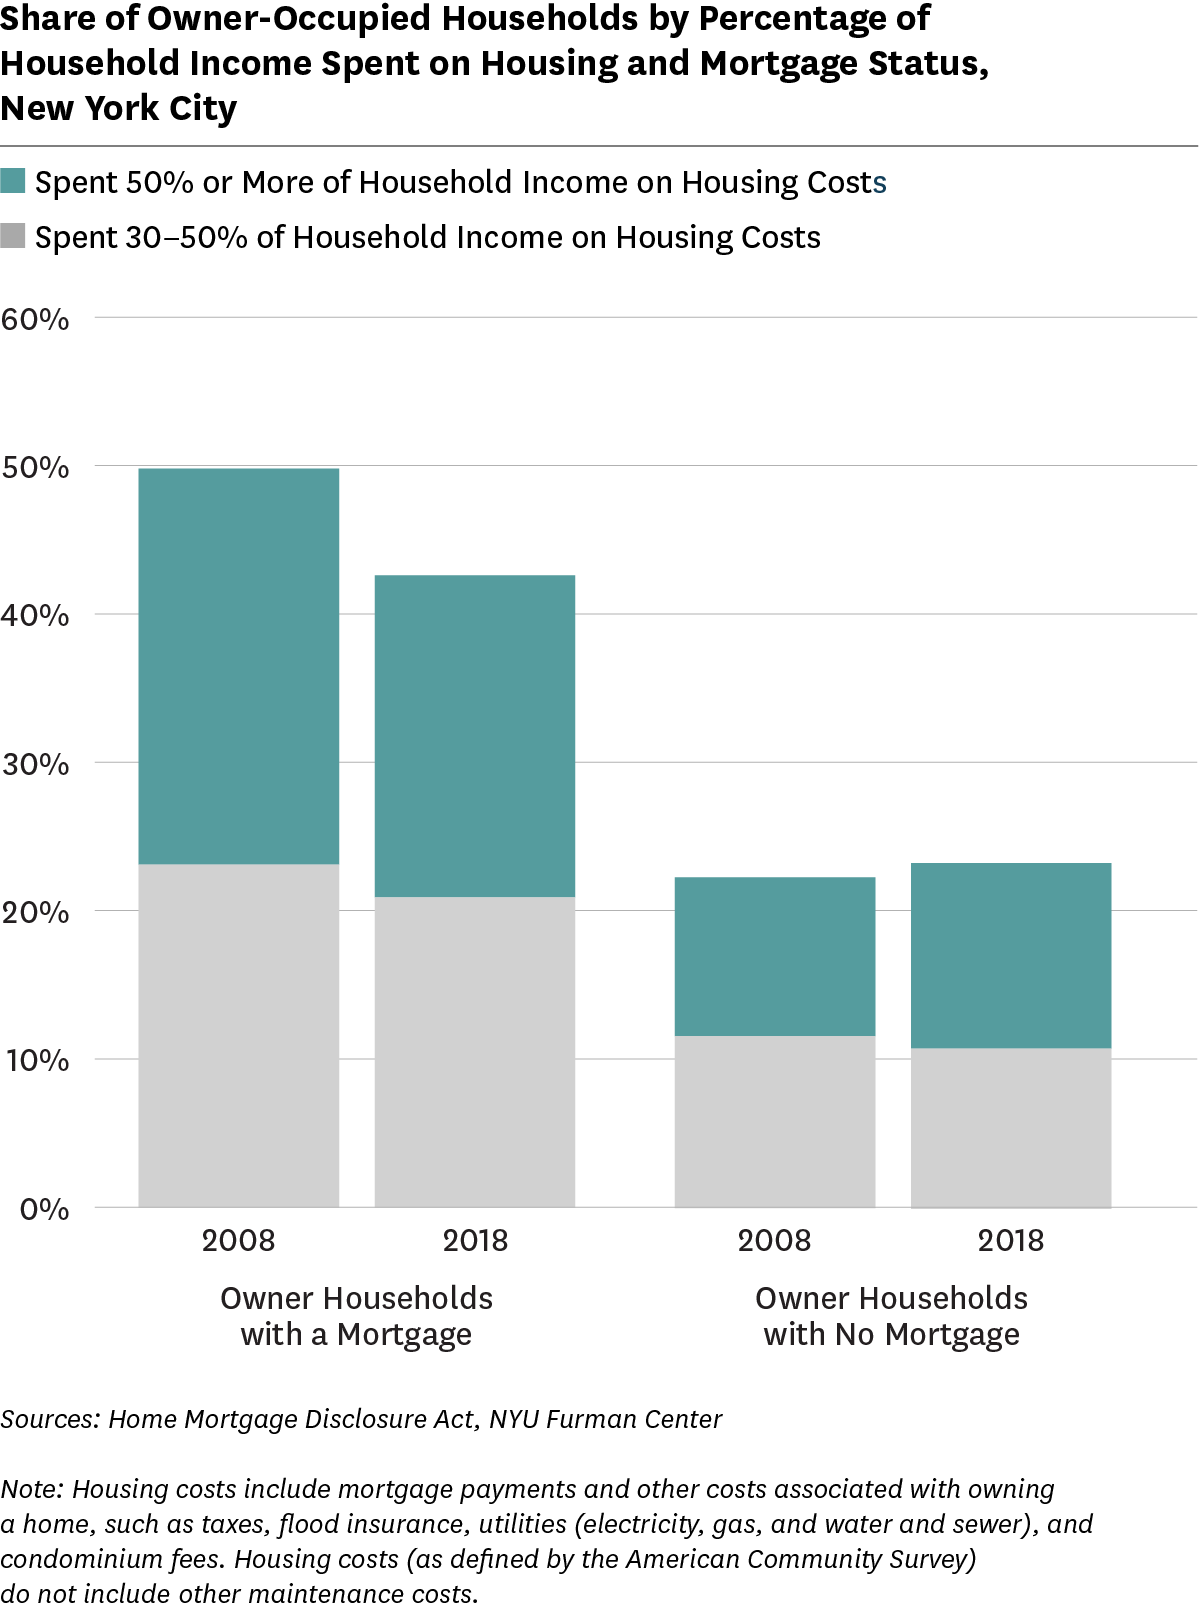
Over 40 percent of New York City homeowners with mortgages were cost burdened.
The United States Department of Housing and Urban Development (HUD) defines moderate housing cost burden as spending 30 percent or more of household income on housing costs, and severe housing cost burden as spending 50 percent or more of household income on housing costs. Ten years after the foreclosure crisis, the percentage of owner-occupied households with mortgages who were cost-burdened declined to about 42.6 percent in 2018 (down from 49.8 percent in 2008). Households without mortgages were far less likely to be cost burdened than those with mortgages, but about one in five households without mortgages faced moderate or severe cost burdens, largely due to taxes and utilities costs.
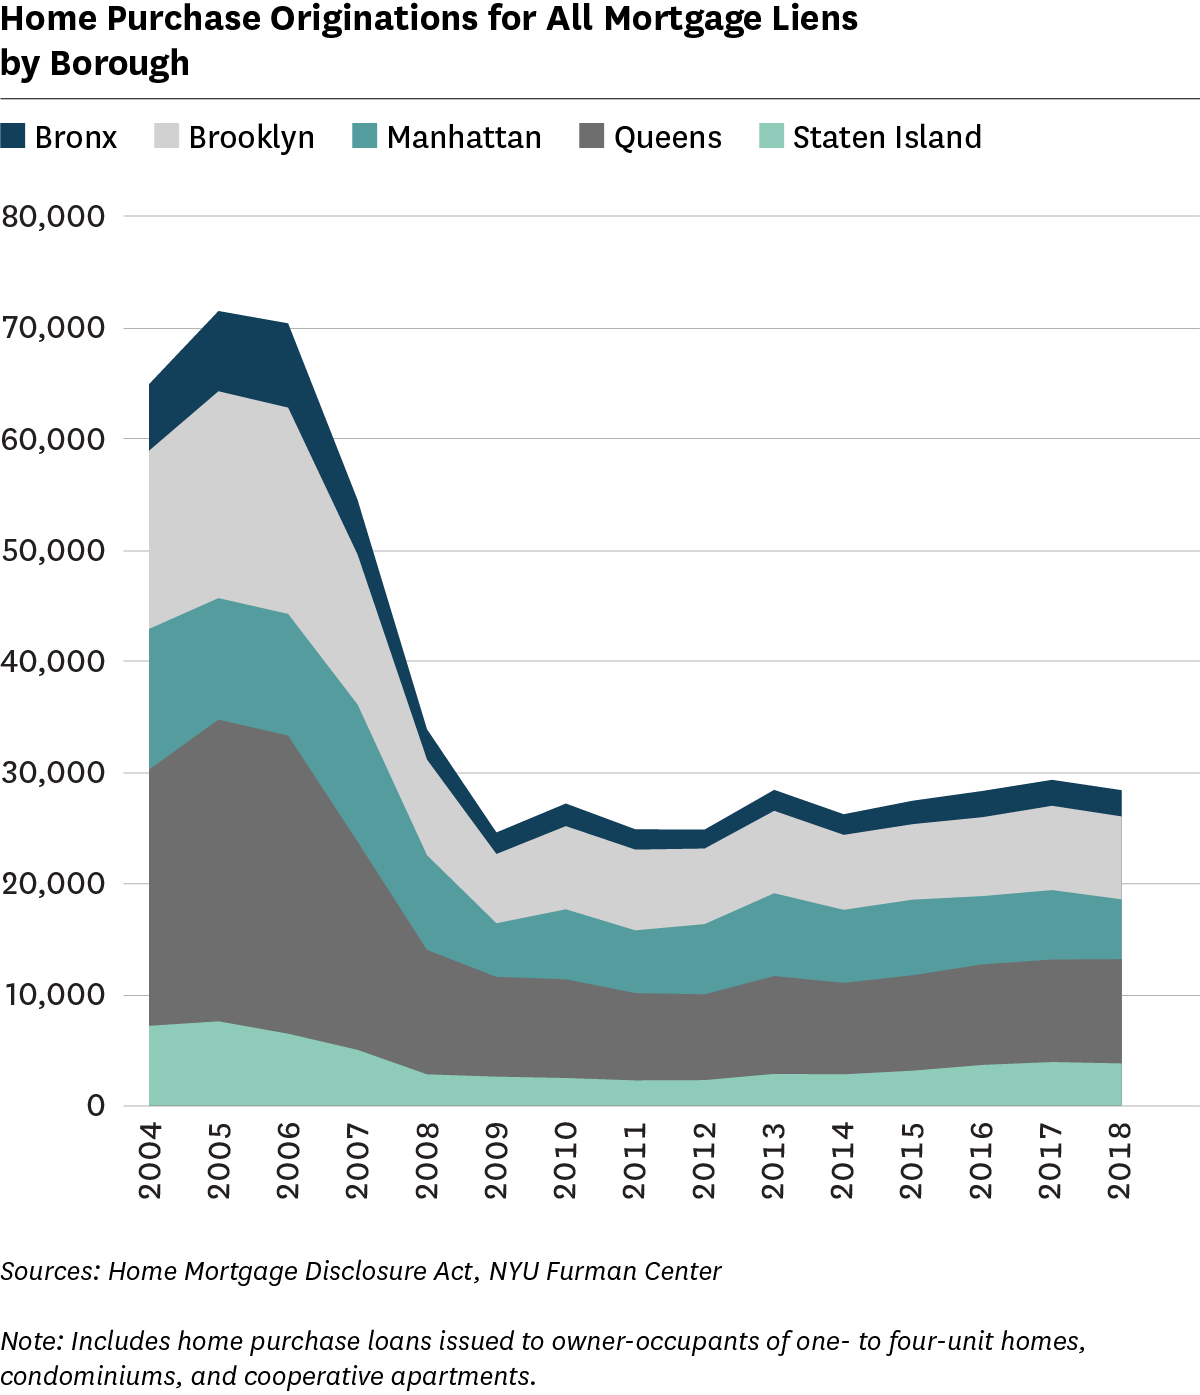
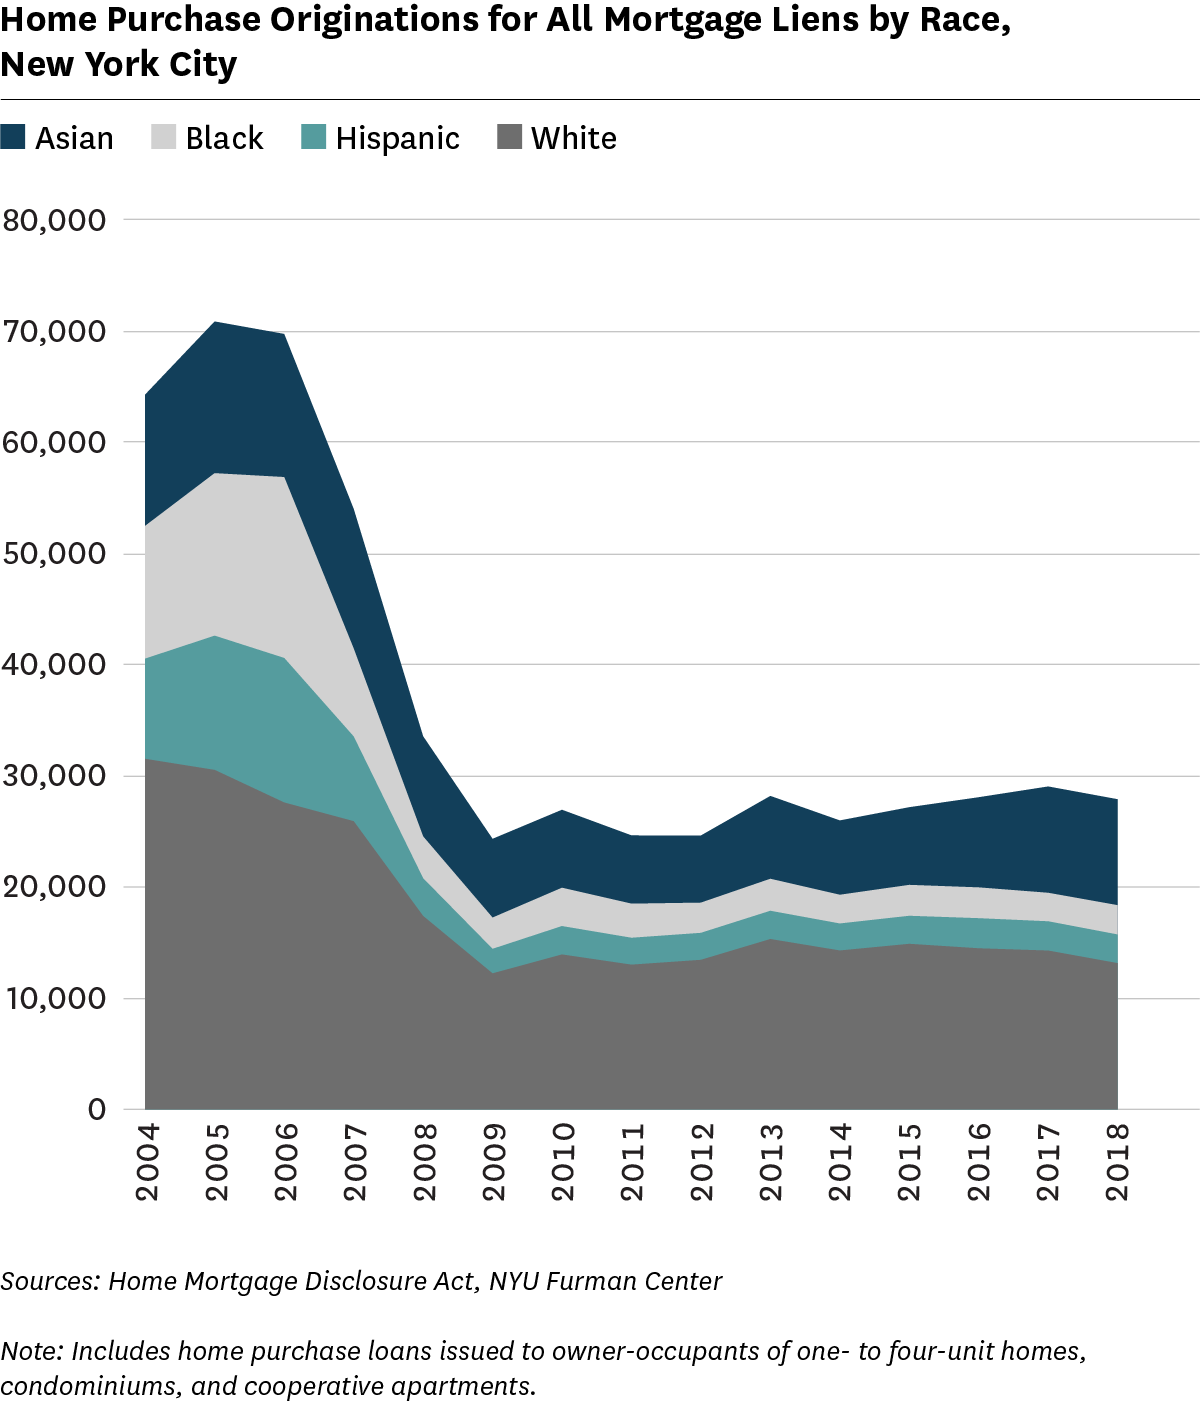
Home purchase originations fell slightly in the last year, driven mostly by decreased loan originations in Manhattan.
Home purchase originations, or the number of new mortgages taken out by borrowers, have remained relatively constant since 2009, following a large decline after the foreclosure crisis. Originations fell slightly in the last year, however, especially in Manhattan, which saw 874 fewer home purchase loans originated in 2018 than 2017. The overall number of mortgage originations in 2018 was less than half of the mortgages originated in 2005.
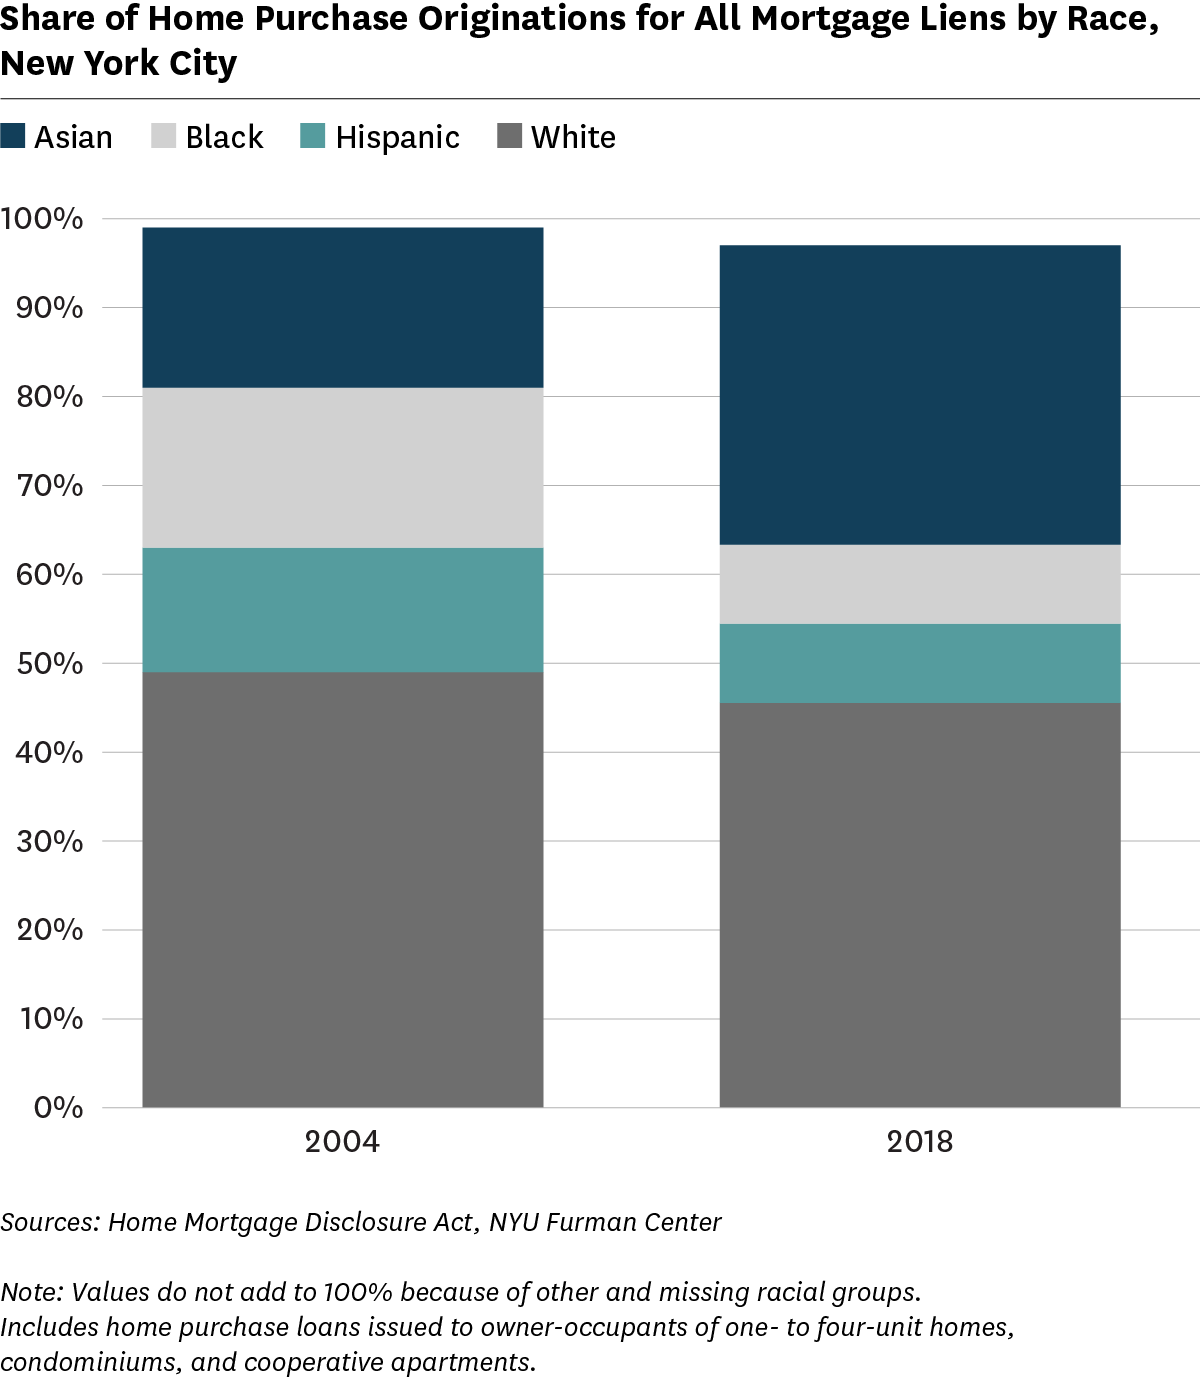
The Asian share of borrowers grew from 2004 to 2018, while the Black and Hispanic shares declined.
When examining home purchase originations by the race of the home purchaser, the share of borrowers who are Asian grew from 18 percent to 34 percent between 2004 and 2018. Conversely, the Black share of borrowers was cut in half between 2004 and 2018, dropping from 18 percent to 9 percent, while the Hispanic share of borrowers declined from 14 percent to 9 percent. The white share of borrowers remained relatively stable, declining roughly three percentage points from 49 to 46 percent between 2004 and 2018.
The volume of home purchase originations decreased from 2017 to 2018, driven primarily by decreased borrowing from white households.
From 2017 to 2018, the volume of home purchase originations decreased slightly. While a slightly larger number of Black households took out mortgages (2.8% increase from 2017 to 2018), this increase was offset by decreases among white (7.9% decrease) and Hispanic (2.1% decrease) households. Asian household borrowing remained relatively steady (0.3% decrease).
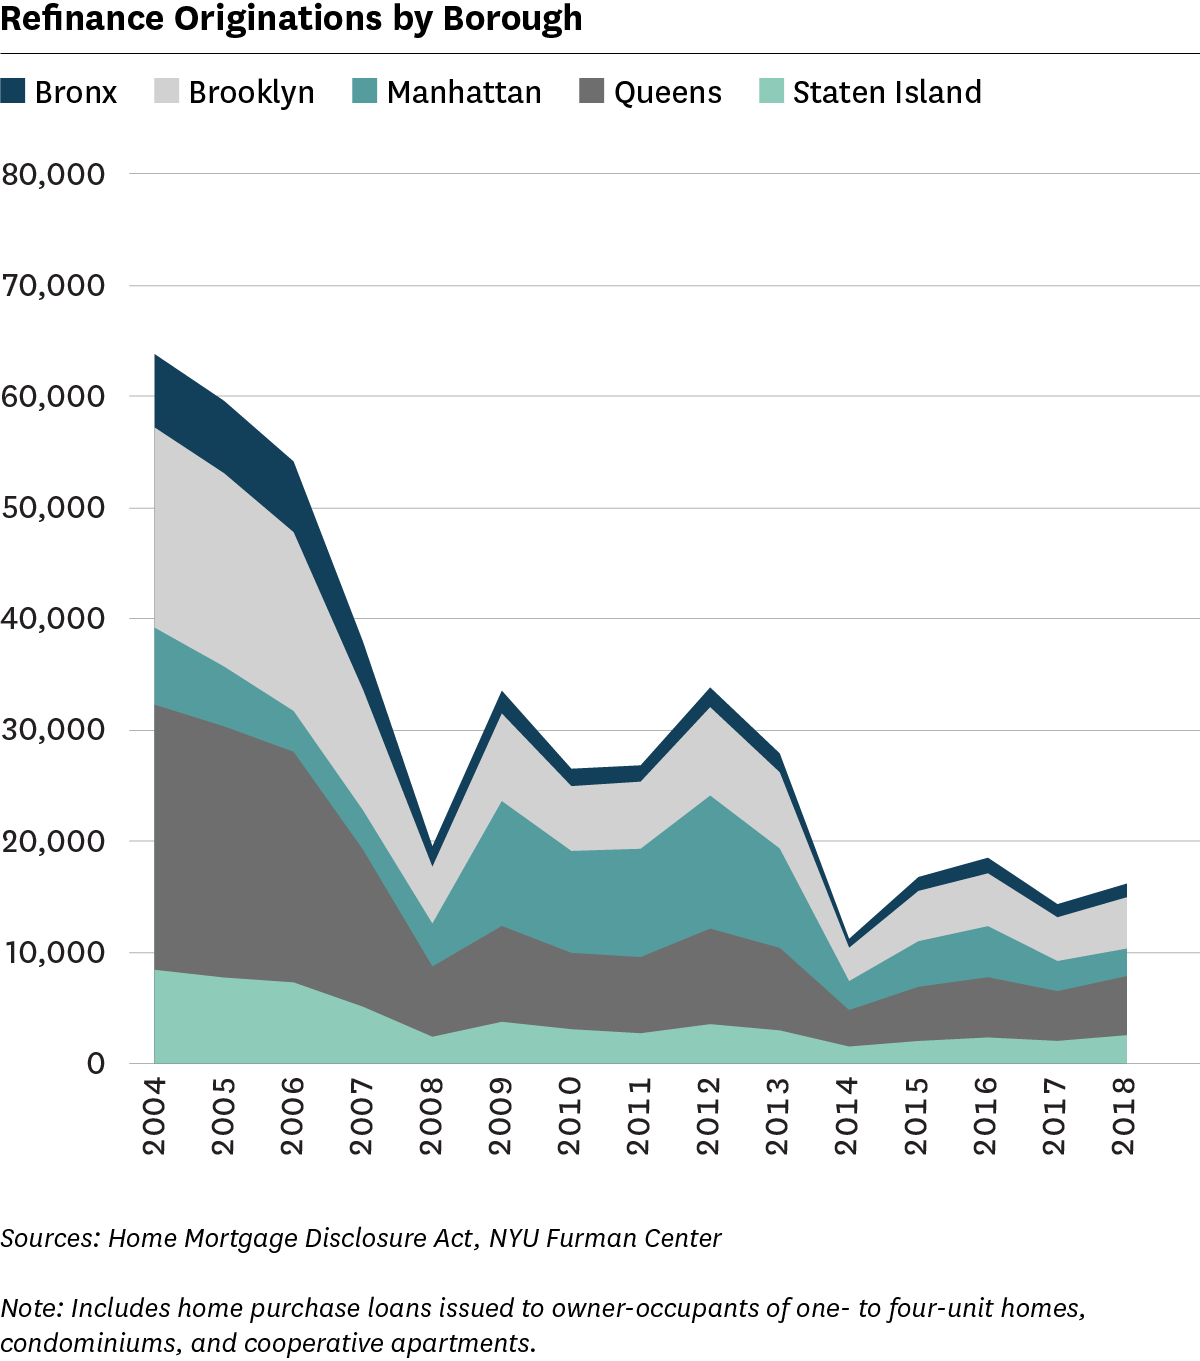
Mortgage refinancings increased slightly in 2018, with refinancing originations increasing in every borough except Manhattan.
Across New York City, the total number of refinance originations increased between 2017 and 2018. The only borough that did not see an increase in refinancing originations was Manhattan (down 9%). The largest increase was in Staten Island (up 26%) followed by Brooklyn (up 17%), Queens (up 19%), and the Bronx (up 4%).
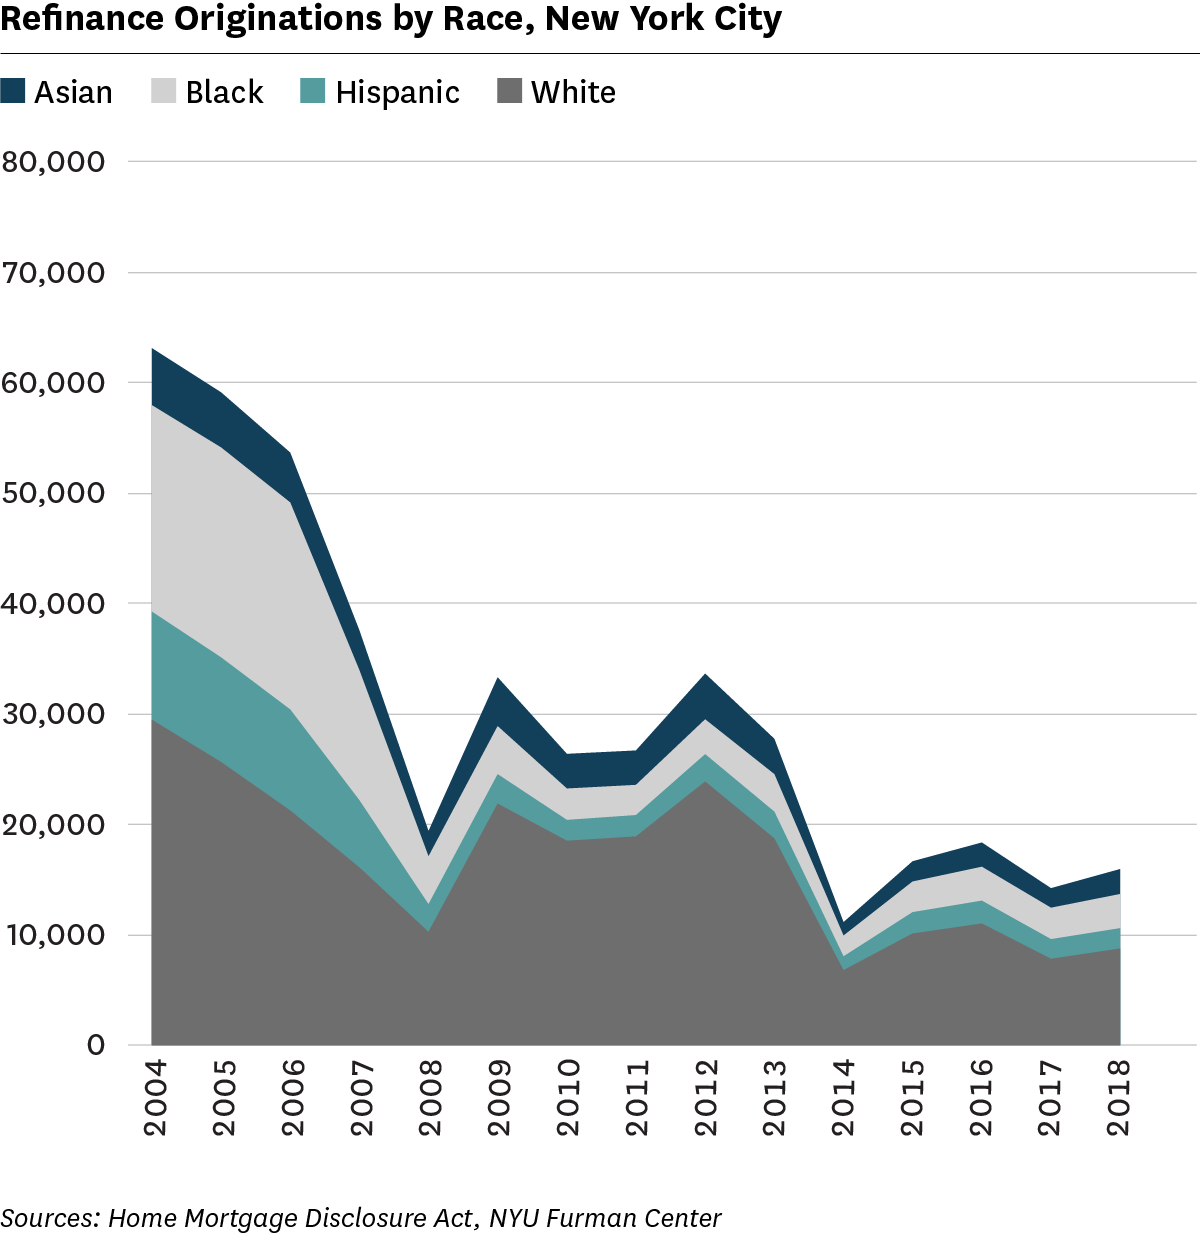
The number of mortgage refinancings increased for each racial group.
The number of refinancing originations increased between 2017 and 2018 for white, Asian, Black, and Hispanic borrowers. Similar to past periods, white borrowers made up the largest share of refinancing originations, comprising 54.9 percent of refinancings in 2018, up from 46.7 percent in 2004. In 2004, Black and Hispanic households made up 29.6 percent and 15.5 percent of total mortgage refinancings respectively. By 2018, these shares had fallen to 19.4 percent and 11.5 percent respectively.
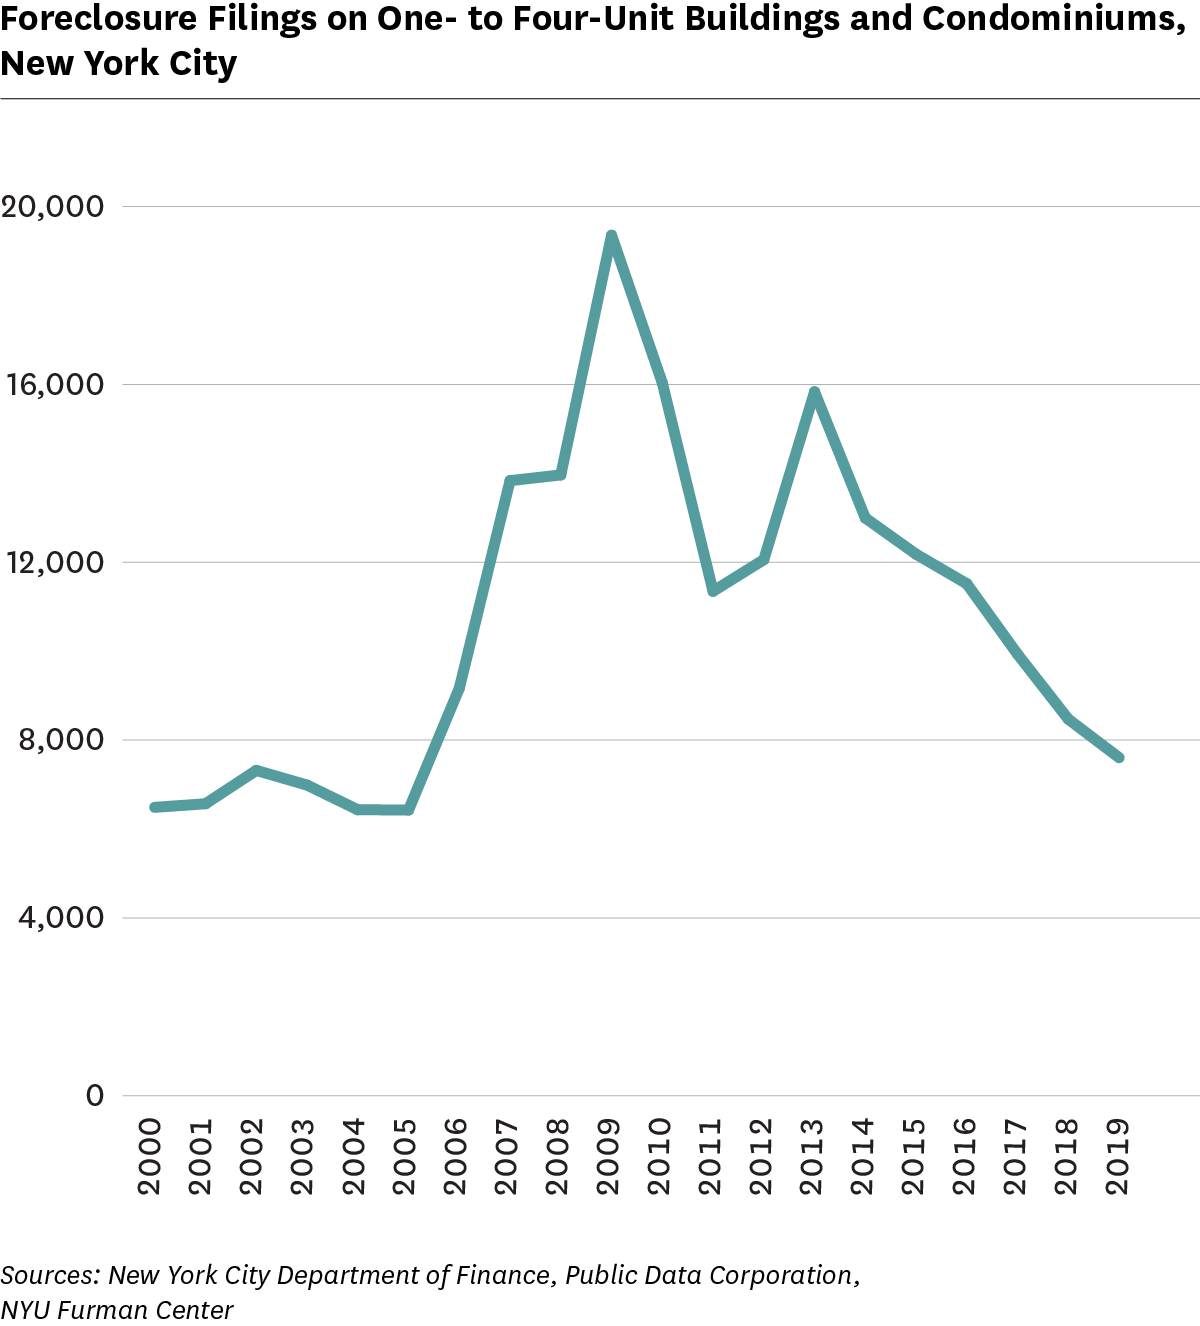
Foreclosure filings on one- to four-unit buildings and condominiums continued to decrease between 2018 and 2019.
After peaking in 2009 and again in 2013, the number of foreclosure filings for one- to four-unit buildings and condominiums decreased by between 5.5 and 17.9 percent annually since then. Between 2018 and 2019, foreclosure filings decreased by 10.2 percent. While the number of filings was less than half of the 2013 peak, it remained higher than the number of filings from the era prior to the foreclosure crisis.
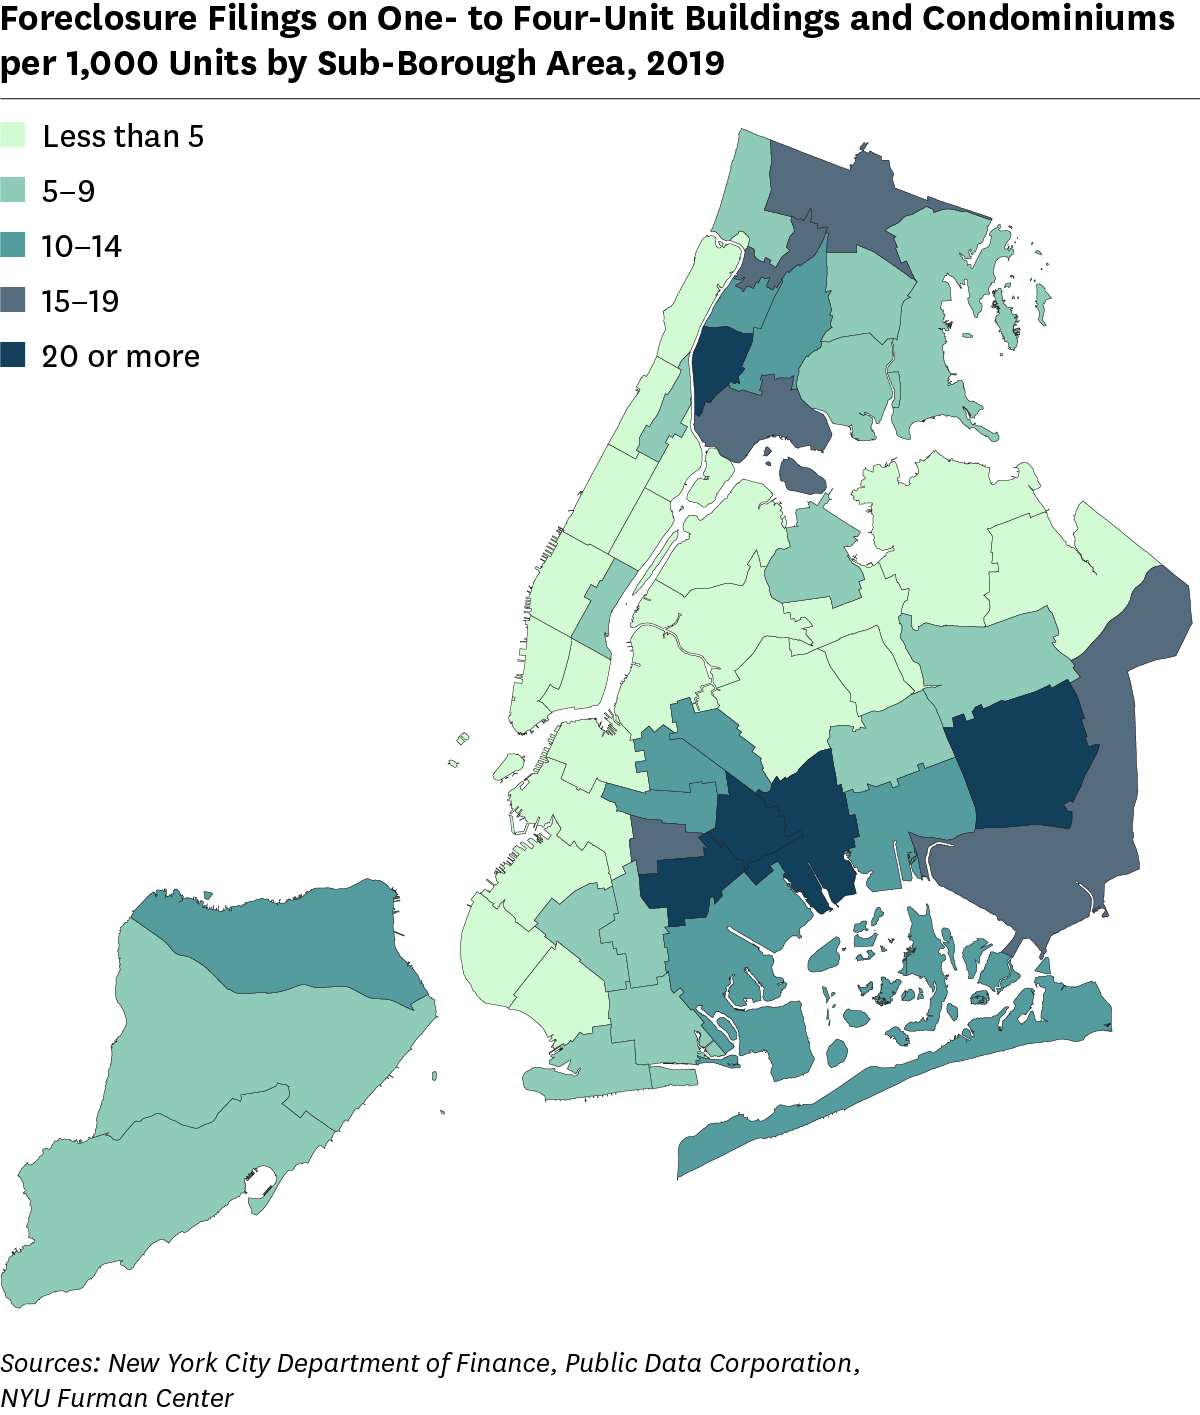
Foreclosure filings on one- to four-unit buildings and condominiums were most common in Brooklyn, the Bronx, and Queens.
Of the five sub-borough areas with a foreclosure filing rate above 20 per 1,000 units in 2019, three were in Brooklyn and one was in the Bronx and Queens, respectively. Highbridge/South Concourse in the Bronx had the highest foreclosure filing rate (29.1 foreclosure filings per thousand units) followed by Brownsville/Ocean Hill, Brooklyn (27.2); Jamaica, Queens (23.9); East New York/Starrett City, Brooklyn (21.4); and East Flatbush, Brooklyn (20.2). The five sub-borough areas with the lowest foreclosure filing rates were all in Manhattan: Lower East Side/Chinatown (0.9), Washington Heights/Inwood (0.9), Greenwich Village/Financial District (1.4), Upper West Side (1.5), and Upper East Side (1.6).
All content © 2005 – 2024 Furman Center for Real Estate and Urban Policy | Top of page | Contact Us