State of the City 2019
| New York City Indicators | |||||
|---|---|---|---|---|---|
| 2000 | 2006 | 2010 | 2018 | 2019 | |
| Demographics | |||||
| Population | 8,008,278 | 8,214,430 | 8,184,900 | 8,398,750 | - |
| Population aged 65+ | 11.7% | 12.1% | 12.2% | 14.8% | - |
| Foreign-born population | 35.9% | 37.0% | 37.2% | 36.8% | - |
| Households with children under 18 years old | 34.0% | 32.3% | 31.5% | 28.3% | - |
| Racial diversity index | 0.74 | 0.73 | 0.74 | 0.75 | - |
| Income diversity ratio | - | 6.1 | 5.9 | 6.6 | - |
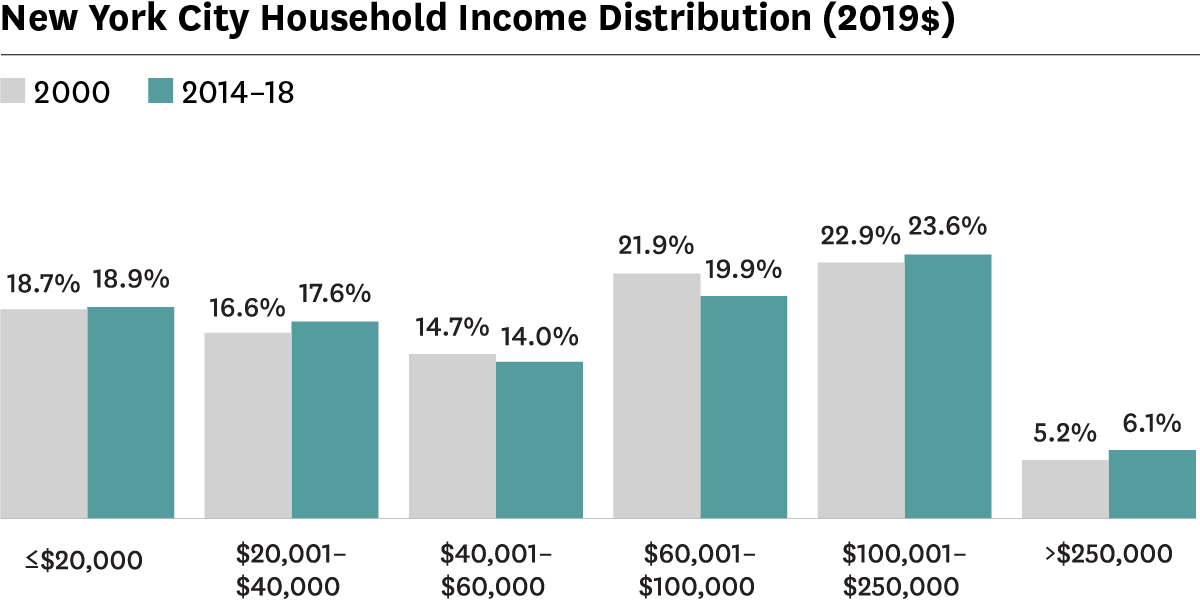
| Median household income (2019$) | $60,180 | $58,580 | $56,290 | $64,850 | - |
| Poverty rate | 21.2% | 19.2% | 20.1% | 17.3% | - |
| Unemployment rate | 9.6% | 7.8% | 11.2% | 5.7% | - |
| Population aged 25+ with a bachelor's degree or higher | 27.4% | 32.1% | 33.4% | 39.0% | - |
| Population aged 25+ without a high school diploma | - | 21.3% | 20.4% | 17.3% | - |
| Housing Market and Conditions | |||||
| Homeownership rate | 30.2% | 34.4% | 32.1% | 32.8% | - |
| Rental vacancy rate | - | 3.8% | 4.4% | 3.4% | - |
| Severe crowding rate (% of renter households) | - | - | 4.2% | 4.5% | - |
| Serious housing code violations (per 1,000 privately owned rental units)1 | - | 60.9 | 60.2 | 53.5 | 85.4 |
| Notices of foreclosure rate (per 1,000 1-4 unit and condo properties) | 9.0 | 11.5 | 19.1 | 9.7 | 8.7 |
| Home purchase loan rate (per 1,000 properties) | - | 42.8 | 20.2 | 20.3 | - |
| Land Use and Development | |||||
| Population density (1,000 persons per square mile) | - | 27.3 | 27.2 | 28.0 | - |
| Units authorized by new residential building permits | 15,544 | 29,345 | 6,753 | 20,012 | 26,762 |
| Units issued new certificates of occupancy | 13,603 | 24,982 | 22,839 | 28,626 | 24,566 |
| Neighborhood Services and Conditions | |||||
| Car-free commute (% of commuters) | 63.8% | 67.3% | 69.4% | 70.0% | - |
| Mean travel time to work (minutes) | 40.0 | 39.0 | 38.7 | 42.0 | - |
| Serious crime rate (per 1,000 residents) | 23.1 | 15.8 | 12.9 | 11.8 | 11.3 |
| Students performing at grade level in ELA, 4th grade | - | - | - | 49.4% | 49.6% |
| Students performing at grade level in math, 4th grade | - | - | - | 46.4% | 49.4% |
| Renters | |||||
| Median rent, all (2019$) | $1,070 | $1,190 | $1,300 | $1,470 | - |
| Median rent, recent movers (2019$) | - | $1,500 | $1,650 | $1,970 | - |
| Rental units affordable at 80% AMI (% of recently available units) | - | 52.5% | 44.9% | 40.9% | - |
| Rental units affordable at 120% AMI (% of recently available units) | - | 81.7% | 78.1% | 77.0% | - |
| Severely rent-burdened households | 23.7% | 27.9% | 29.1% | 28.1% | - |
| Severely rent-burdened households, low income households | - | 43.9% | 45.7% | 44.9% | - |
| Housing choice vouchers (% of occupied, privately owned rental units) | - | - | 6.9% | 6.3% | - |
| Public housing (% of rental units) | - | - | - | 8.1% | - |
|
1
In 2019 some violations types were reclassified into the most serious class, resulting in an increase in this indicator.
|
|||||
| New York City Indicators by Race and Ethnicity, 2018 | ||||
|---|---|---|---|---|
| Asian | Black | Hispanic | White | |
| Demographics | ||||
| Population | 1,192,303 | 2,039,194 | 2,449,451 | 2,675,819 |
| Percentage change since 2000 | 52.8% | 3.9% | 13.4% | −4.5% |
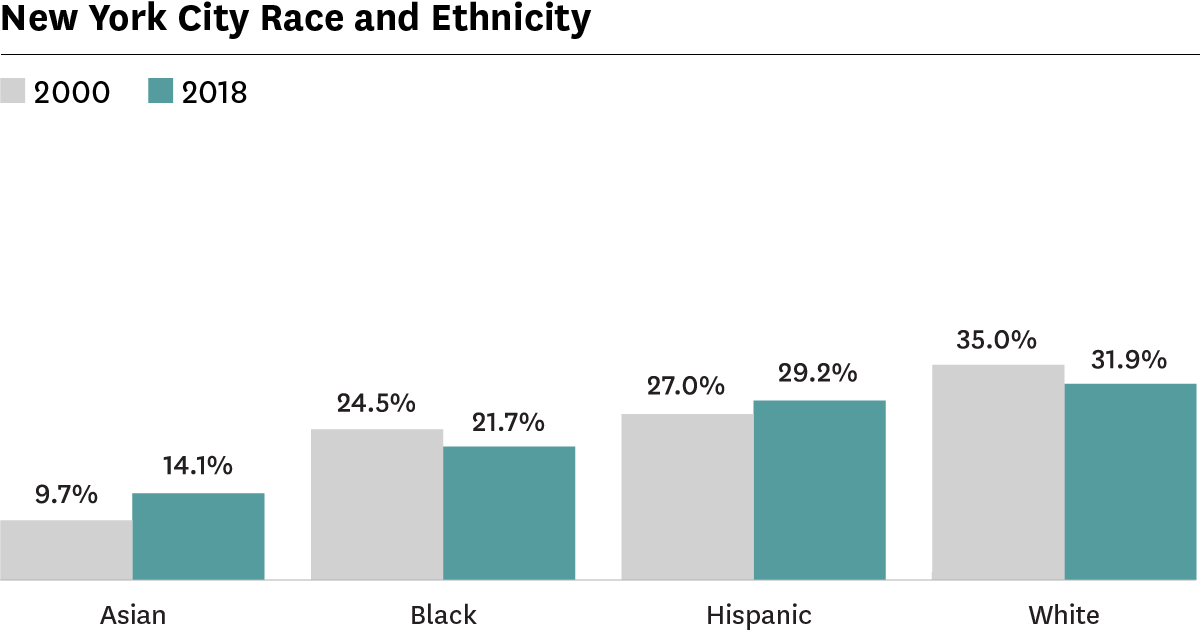
| Share of New York City population | 14.2% | 24.3% | 29.2% | 31.9% |
| Percentage point change since 2000 | 4.5 | −0.2 | 2.2 | −3.1 |
| Foreign-born population1 | 70.5% | 32.5% | 40.0% | 22.2% |
| Percentage point change since 2000 | −7.1 | 3.5 | −1.2 | −1.0 |
| Population under 18 years old1 | 17.1% | 21.6% | 25.2% | 16.8% |
| Percentage point change since 2000 | −13.5 | −7.7 | −5.4 | −1.8 |
| Population aged 65+1 | 13.7% | 14.4% | 11.2% | 19.3% |
| Percentage point change since 2000 | 6.2 | 5.9 | 4.8 | 2.4 |
| Disabled population1 | 3.5% | 9.6% | 10.4% | 6.0% |
| Median household income (2018$) | $71,236 | $48,938 | $45,193 | $95,718 |
| Percentage change since 1999 | 10.2% | 0.3% | 3.6% | 20.1% |
| Poverty rate1 | 15.4% | 20.0% | 23.7% | 11.0% |
| Percentage point change since 2000 | −4.2 | −5.7 | −7.0 | −0.5 |
| Poverty rate, population under 18 years old1 | 18.3% | 26.0% | 32.0% | 16.4% |
| Percentage point change since 2000 | −5.7 | −7.9 | −7.9 | 0.2 |
| Poverty rate, population aged 65+1 | 25.4% | 18.5% | 27.1% | 12.6% |
| Percentage point change since 2000 | 1.1 | −4.8 | −2.9 | 0.8 |
| Unemployment rate1 | 4.5% | 8.3% | 7.5% | 3.5% |
| Percentage point change since 2000 | −1.9 | −5.8 | −6.3 | −1.8 |
| Population aged 25+ with a bachelor's degree or higher1 | 44.3% | 24.6% | 19.1% | 60.7% |
| Percentage point change since 2000 | 8.1 | 8.9 | 8.6 | 18.8 |
| Population aged 25+ without a high school diploma1 | 23.2% | 16.1% | 30.2% | 6.0% |
| Percentage point change since 2000 | −7.3 | −13.5 | −16.3 | −9.2 |
| Housing Market and Conditions | ||||
| Homeownership rate1 | 43.5% | 26.8% | 16.7% | 42.6% |
| Percentage point change since 2000 | 8.9 | 2.3 | 2.7 | 6.1 |
| Severe crowding rate (% of renter households) | 7.8% | 3.1% | 5.9% | 2.9% |
| Share of home purchase loans2 | 33.7% | 9.3% | 9.1% | 46.4% |
| Percentage point change since 2006 | 0.1 | −0.1 | −0.1 | 0.0 |
| Share of refinance loans3 | 14.0% | 19.1% | 11.4% | 54.1% |
| Percentage point change since 2006 | 0.1 | −0.2 | −0.1 | 0.1 |
| Neighborhood Services and Conditions | ||||
| Car-free commute (% of commuters) | 67.5% | 67.3% | 73.9% | 71.3% |
| Mean travel time to work (minutes) | 42.7 | 48.0 | 42.8 | 37.8 |
| Students performing at grade level in ELA, 4th grade4 | 69.9% | 37.6% | 38.8% | 67.9% |
| Students performing at grade level in math, 4th grade4 | 77.5% | 31.6% | 37.0% | 69.9% |
| Renters | ||||
| Median rent burden | 35.0% | 34.2% | 36.3% | 28.8% |
| Moderately rent-burdened households | 23.3% | 25.8% | 26.7% | 22.2% |
| Severely rent-burdened households | 31.9% | 30.1% | 33.1% | 23.1% |
|
1
It is not possible to disaggregate the data for blacks and Asians by Hispanic ethnicity, therefore some double counting may occur.
2
Values indicate race/ethnic share of all home purchase loans.
3
Values indicate race/ethnic share of all refinance loans.
4
Values are for 2018
|
||||
| Bronx Indicators | |||||||
|---|---|---|---|---|---|---|---|
| 2000 | 2006 | 2010 | 2018 | 2019 | 2000 Rank | 2018-19 Rank |
|
| Demographics | |||||||
| Population | 1,327,690 | 1,361,470 | 1,386,660 | 1,432,130 | - | - | - |
| Population aged 65+ | 10.1% | 10.3% | 10.6% | 12.8% | - | 5 | 5 |
| Foreign-born population | 29.3% | 31.8% | 34.3% | 34.4% | - | 4 | 3 |
| Households with children under 18 years old | 43.8% | 41.3% | 41.3% | 35.7% | - | 1 | 1 |
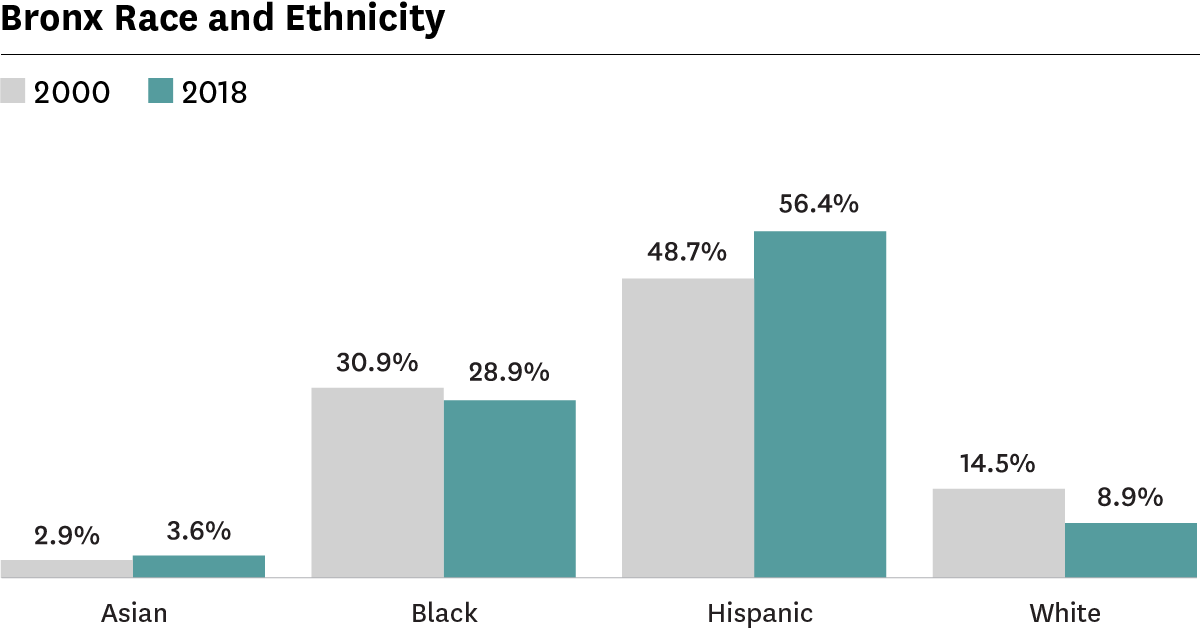
| Racial diversity index | 0.65 | 0.63 | 0.61 | 0.59 | - | 4 | 4 |
| Income diversity ratio | - | 5.7 | 5.8 | 6.4 | - | - | 2 |
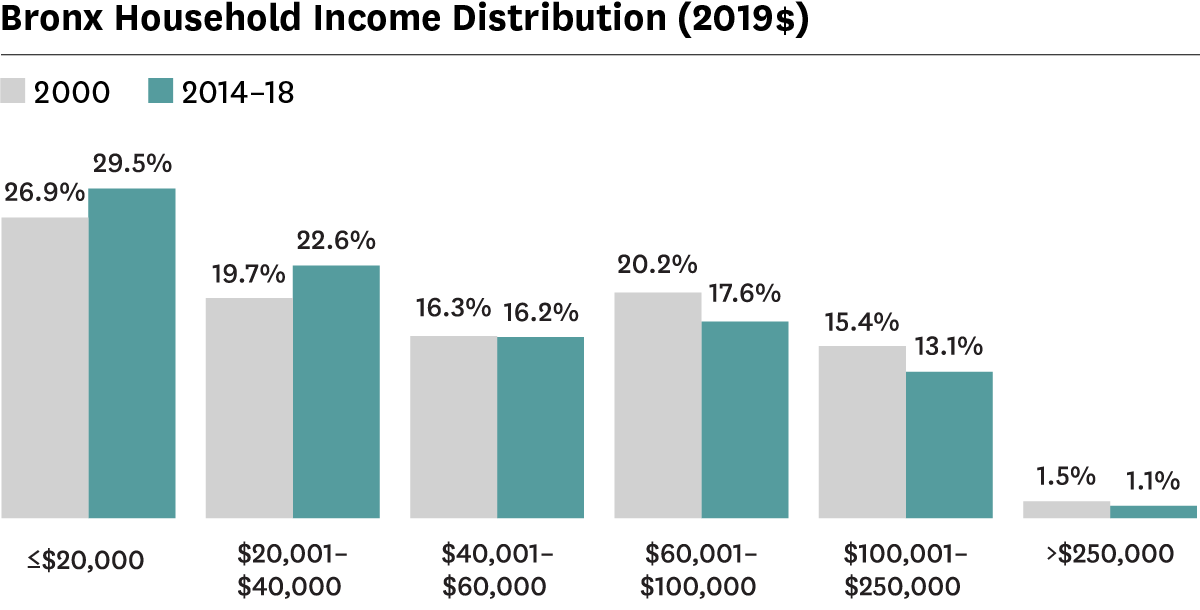
| Median household income (2019$) | $43,390 | $39,690 | $37,610 | $39,100 | - | 5 | 5 |
| Poverty rate | 30.7% | 29.1% | 30.2% | 27.4% | - | 1 | 1 |
| Unemployment rate | 14.3% | 11.8% | 15.8% | 10.1% | - | 1 | 1 |
| Population aged 25+ with a bachelor's degree or higher | 14.6% | 16.4% | 16.9% | 20.7% | - | 5 | 5 |
| Population aged 25+ without a high school diploma | - | 31.6% | 30.8% | 26.7% | - | - | 1 |
| Housing Market and Conditions | |||||||
| Homeownership rate | 19.5% | 21.5% | 18.8% | 18.5% | - | 5 | 5 |
| Rental vacancy rate1 | - | - | 3.7% | 2.1% | - | - | 5 |
| Severe crowding rate (% of renter households)1 | - | - | 4.1% | 5.6% | - | - | 1 |
| Serious housing code violations (per 1,000 privately owned rental units)2 | - | 127.5 | 114.2 | 91.9 | 160.9 | - | 1 |
| Notices of foreclosure rate (per 1,000 1-4 unit and condo properties) | 10.4 | 14.7 | 23.0 | 12.7 | 11.1 | 2 | 1 |
| Home purchase loan rate (per 1,000 properties) | - | 40.4 | 14.6 | 16.7 | - | - | 4 |
| Land Use and Development | |||||||
| Population density (1,000 persons per square mile) | - | 32.4 | 33.0 | 34.1 | - | - | 3 |
| Units authorized by new residential building permits | 3,045 | 4,430 | 1,497 | 4,064 | 5,930 | 3 | 2 |
| Units issued new certificates of occupancy | 1,390 | 4,226 | 4,174 | 4,760 | 4,332 | 5 | 4 |
| Neighborhood Services and Conditions | |||||||
| Car-free commute (% of commuters) | 61.1% | 65.8% | 69.4% | 68.6% | - | 3 | 3 |
| Mean travel time to work (minutes) | 43.0 | 40.6 | 42.9 | 45.2 | - | 3 | 2 |
| Serious crime rate (per 1,000 residents) | 23.8 | 16.6 | 14.3 | 14.2 | 13.8 | 2 | 2 |
| Students performing at grade level in ELA, 4th grade | - | - | - | 33.9% | 36.0% | - | 5 |
| Students performing at grade level in math, 4th grade | - | - | - | 29.5% | 33.1% | - | 5 |
| Renters | |||||||
| Median rent, all (2019$) | $940 | $1,040 | $1,120 | $1,210 | - | 5 | 5 |
| Median rent, recent movers (2019$) | - | - | $1,200 | $1,380 | - | - | 5 |
| Rental units affordable at 80% AMI (% of recently available units)1 | - | - | 81.0% | 84.4% | - | - | 1 |
| Severely rent-burdened households1 | 27.2% | - | 31.8% | 34.8% | - | 1 | 1 |
| Severely rent-burdened households, low income households1 | - | - | 40.8% | 42.6% | - | - | 4 |
| Housing choice vouchers (% of occupied, privately owned rental units) | - | - | 14.8% | 13.9% | - | - | 1 |
| Public housing (% of rental units) | - | - | - | 9.7% | - | - | 1 |
|
1
These indicators use five-year American Community Survey (ACS) estimates. Data under the 2010 heading comes from the 2006–2010 ACS and data under the 2018 heading comes from the 2014–2018 ACS.
2
In 2019 some violations types were reclassified into the most serious class, resulting in an increase in this indicator.
|
|||||||
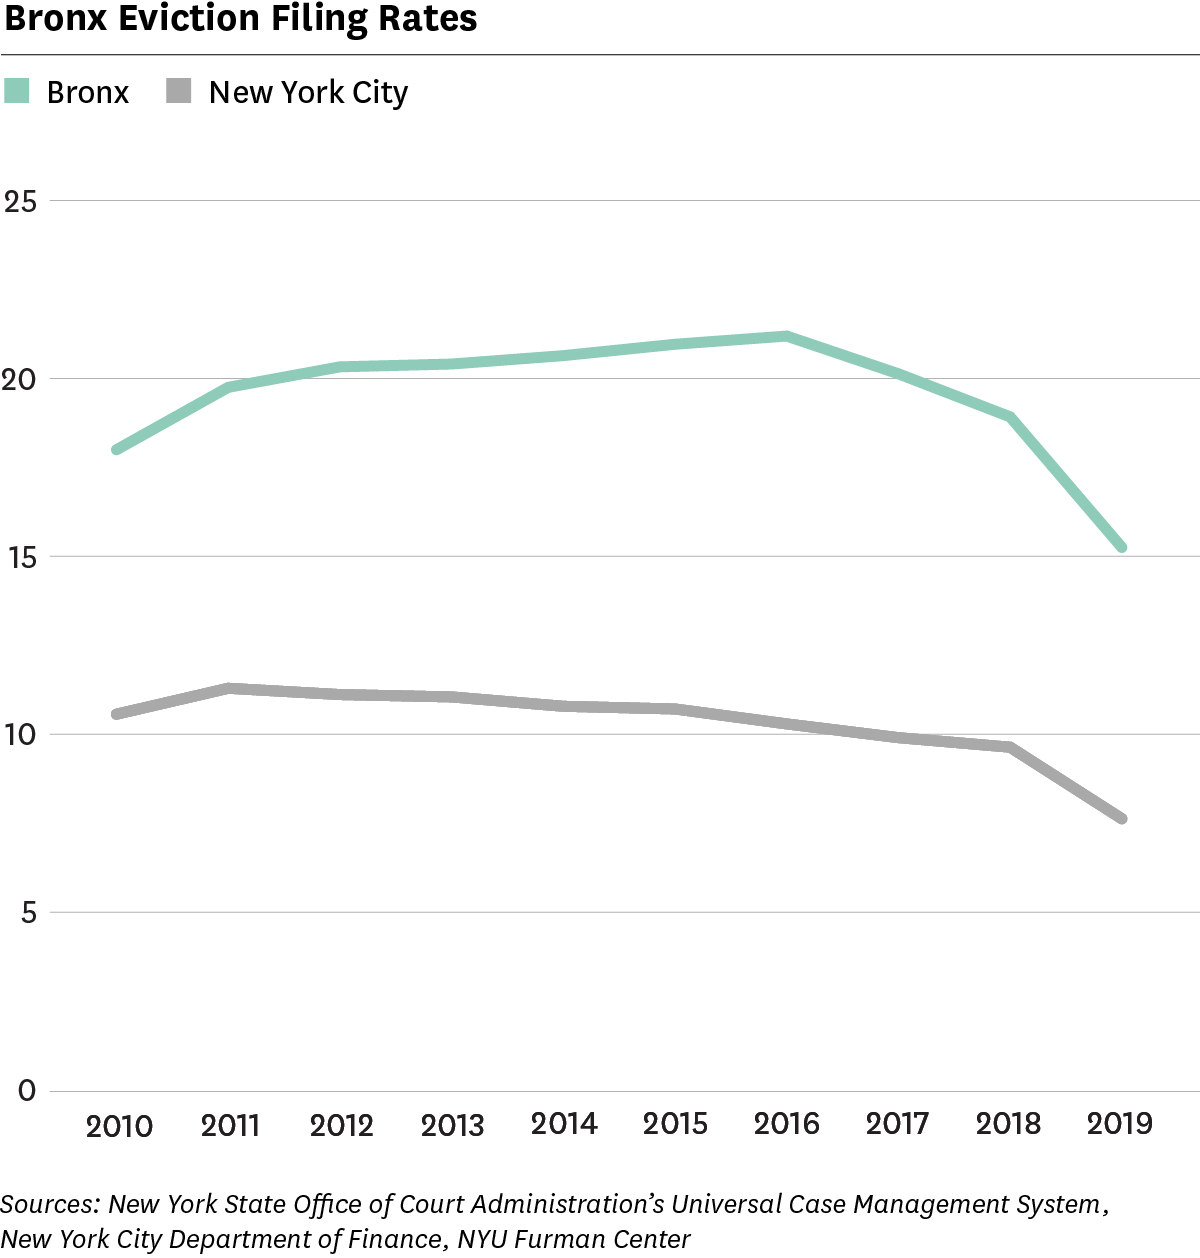
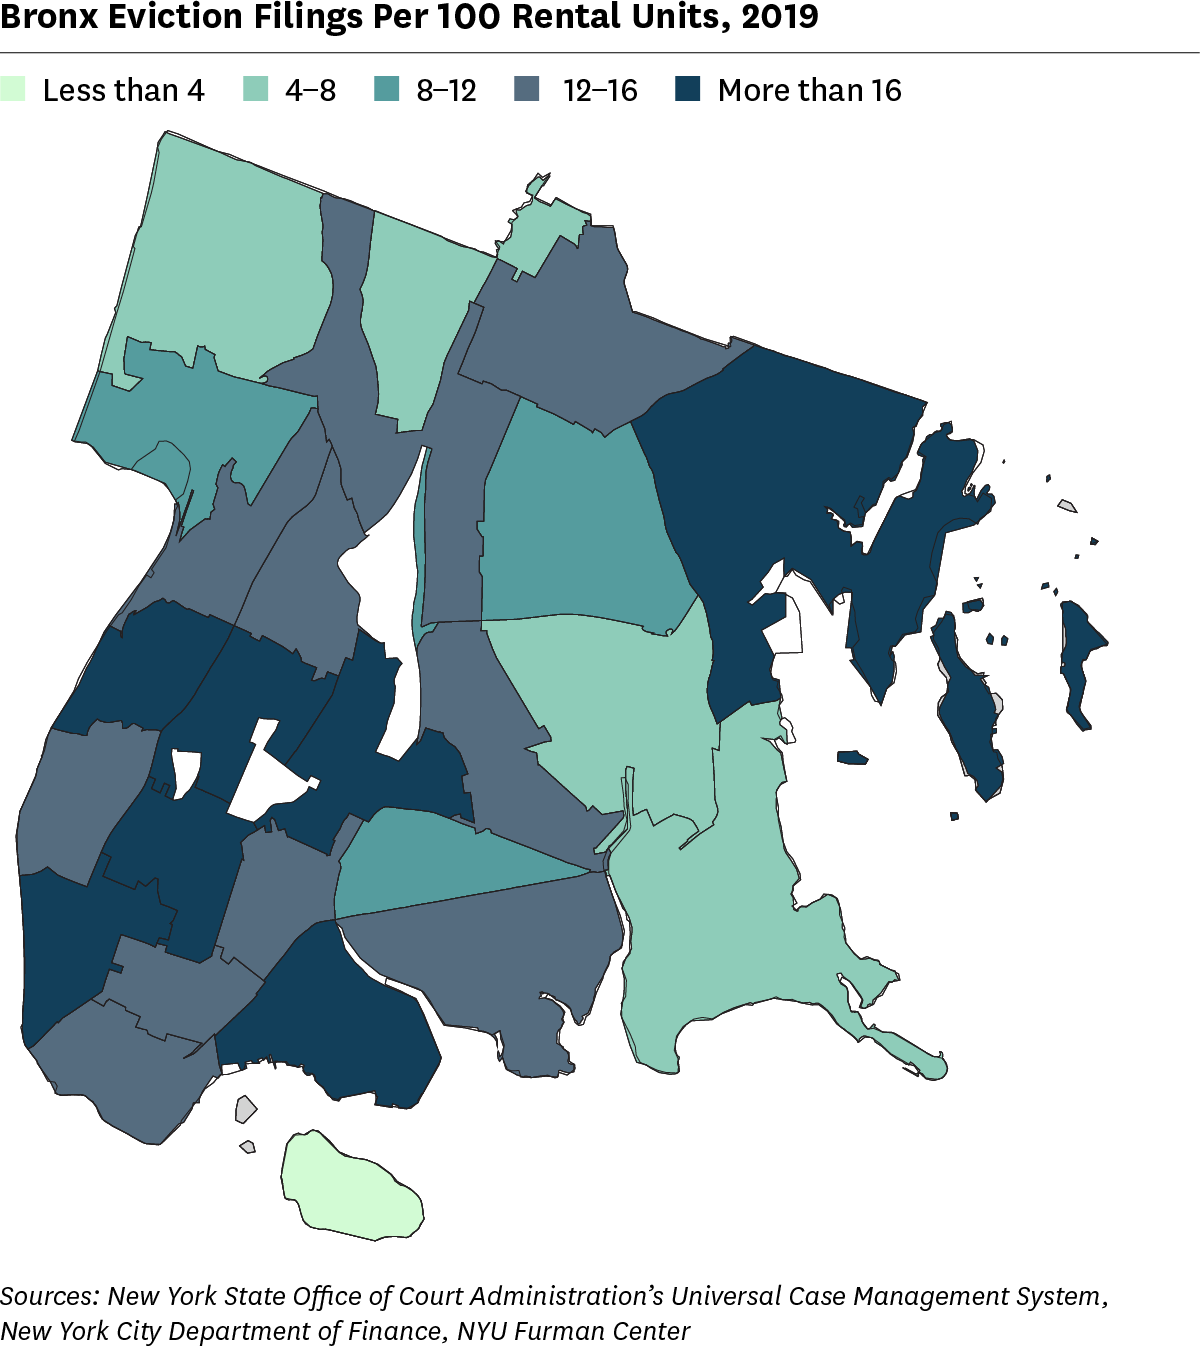
| Bronx Eviction Filings, 2019 | ||
|---|---|---|
| Total Filings | Filings Per 100 Units | |
| All Rental Units | 62,893 | 15.64 |
| Private Rental Units | 54,918 | 15.16 |
| Sources: New York State Office of Court Administration’s Universal Case Management System, New York City Department of Finance, NYU Furman Center | ||
| Brooklyn Indicators | |||||||
|---|---|---|---|---|---|---|---|
| 2000 | 2006 | 2010 | 2018 | 2019 | 2000 Rank | 2018-19 Rank |
|
| Demographics | |||||||
| Population | 2,465,326 | 2,508,820 | 2,508,340 | 2,582,830 | - | - | - |
| Population aged 65+ | 11.5% | 12.0% | 11.5% | 13.9% | - | 4 | 4 |
| Foreign-born population | 37.8% | 37.8% | 37.8% | 35.6% | - | 2 | 2 |
| Households with children under 18 years old | 38.2% | 34.7% | 34.2% | 29.8% | - | 3 | 4 |
| Racial diversity index | 0.72 | 0.71 | 0.72 | 0.73 | - | 2 | 2 |
| Income diversity ratio | - | 6.3 | 5.7 | 6.4 | - | - | 2 |
| Median household income (2019$) | $50,500 | $50,910 | $48,670 | $62,230 | - | 4 | 4 |
| Poverty rate | 25.1% | 22.6% | 23.0% | 19.0% | - | 2 | 2 |
| Unemployment rate | 10.7% | 7.4% | 10.9% | 4.9% | - | 2 | 3 |
| Population aged 25+ with a bachelor's degree or higher | 21.8% | 27.9% | 28.6% | 38.9% | - | 4 | 2 |
| Population aged 25+ without a high school diploma | - | 22.6% | 21.6% | 16.6% | - | - | 3 |
| Housing Market and Conditions | |||||||
| Homeownership rate | 27.1% | 32.3% | 30.2% | 30.6% | - | 3 | 3 |
| Rental vacancy rate1 | - | - | 4.0% | 3.4% | - | - | 3 |
| Severe crowding rate (% of renter households)1 | - | - | 4.4% | 4.7% | - | - | 3 |
| Serious housing code violations (per 1,000 privately owned rental units)2 | - | 71.7 | 71.0 | 60.8 | 96.9 | - | 2 |
| Notices of foreclosure rate (per 1,000 1-4 unit and condo properties) | 10.9 | 14.4 | 23.2 | 11.4 | 10.3 | 1 | 2 |
| Home purchase loan rate (per 1,000 properties) | - | 45.2 | 22.9 | 21.4 | - | - | 2 |
| Land Use and Development | |||||||
| Population density (1,000 persons per square mile) | - | 36.2 | 36.2 | 37.2 | - | - | 2 |
| Units authorized by new residential building permits | 4,980 | 8,889 | 2,158 | 7,885 | 9,487 | 1 | 1 |
| Units issued new certificates of occupancy | 1,611 | 6,129 | 7,256 | 9,428 | 10,275 | 4 | 1 |
| Neighborhood Services and Conditions | |||||||
| Car-free commute (% of commuters) | 67.6% | 71.3% | 74.4% | 74.6% | - | 2 | 2 |
| Mean travel time to work (minutes) | 43.2 | 41.4 | 40.7 | 43.4 | - | 2 | 4 |
| Serious crime rate (per 1,000 residents) | 22.9 | 15.8 | 13.2 | 11.2 | 10.6 | 3 | 3 |
| Students performing at grade level in ELA, 4th grade | - | - | - | 51.4% | 51.2% | - | 4 |
| Students performing at grade level in math, 4th grade | - | - | - | 49.0% | 52.3% | - | 4 |
| Renters | |||||||
| Median rent, all (2019$) | $1,020 | $1,130 | $1,250 | $1,460 | - | 4 | 3 |
| Median rent, recent movers (2019$) | - | - | $1,440 | $1,850 | - | - | 2 |
| Rental units affordable at 80% AMI (% of recently available units)1 | - | - | 60.5% | 49.0% | - | - | 4 |
| Severely rent-burdened households1 | 26.5% | - | 29.3% | 30.6% | - | 2 | 3 |
| Severely rent-burdened households, low income households1 | - | - | 43.0% | 45.6% | - | - | 2 |
| Housing choice vouchers (% of occupied, privately owned rental units) | - | - | 7.8% | 6.3% | - | - | 2 |
| Public housing (% of rental units) | - | - | - | 8.7% | - | - | 3 |
|
1
These indicators use five-year American Community Survey (ACS) estimates. Data under the 2010 heading comes from the 2006–2010 ACS and data under the 2018 heading comes from the 2014–2018 ACS.
2
In 2019 some violations types were reclassified into the most serious class, resulting in an increase in this indicator.
|
|||||||
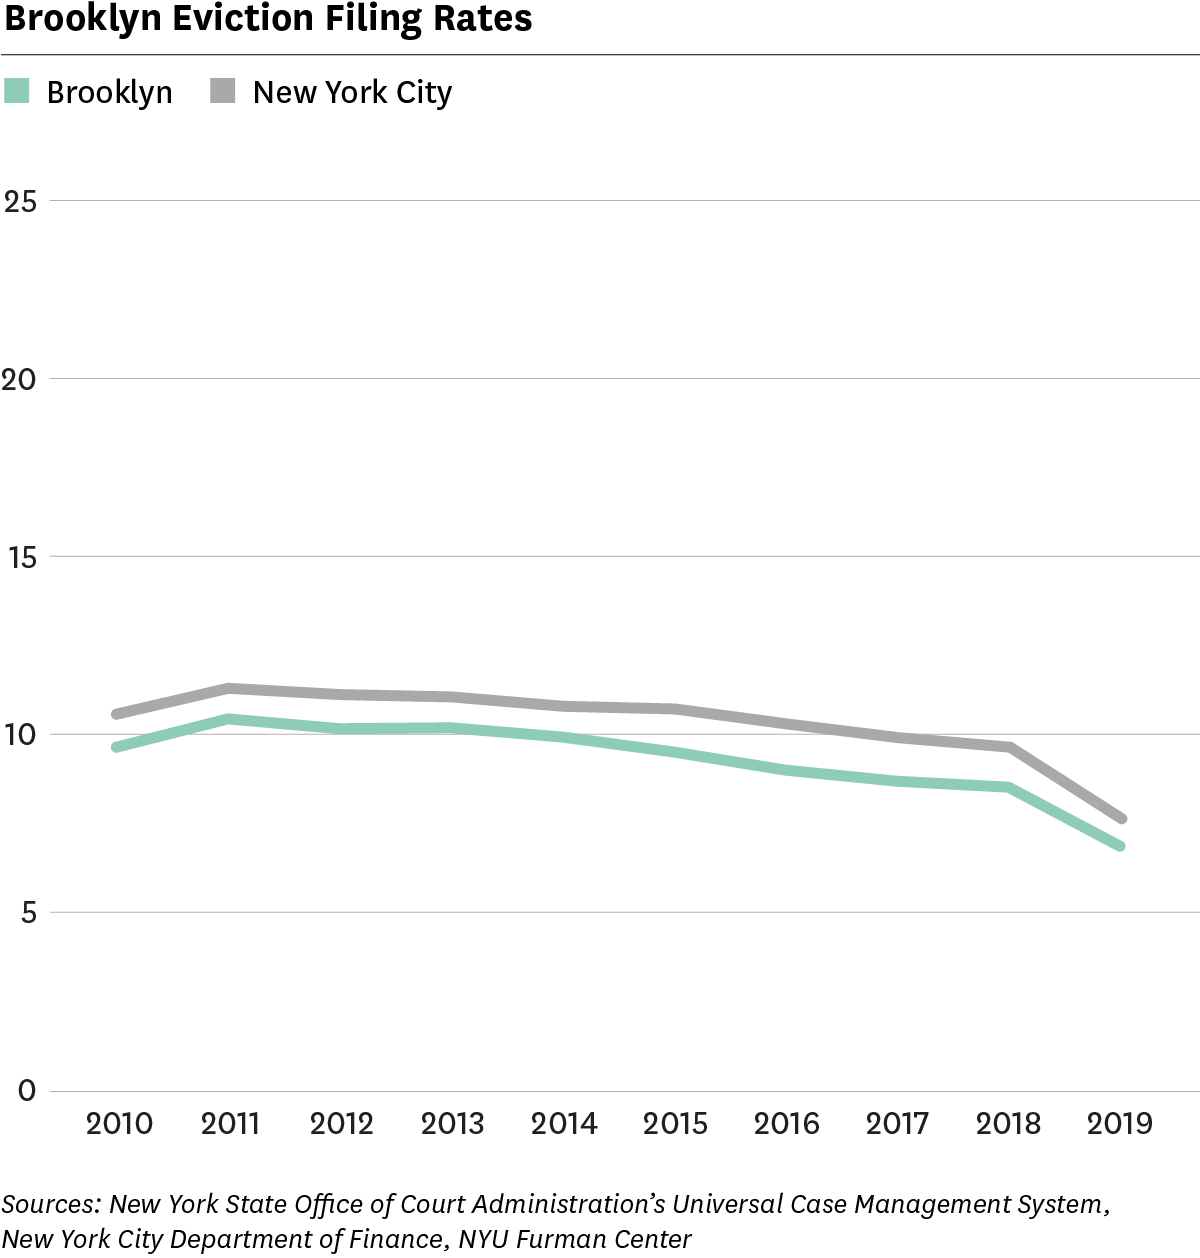
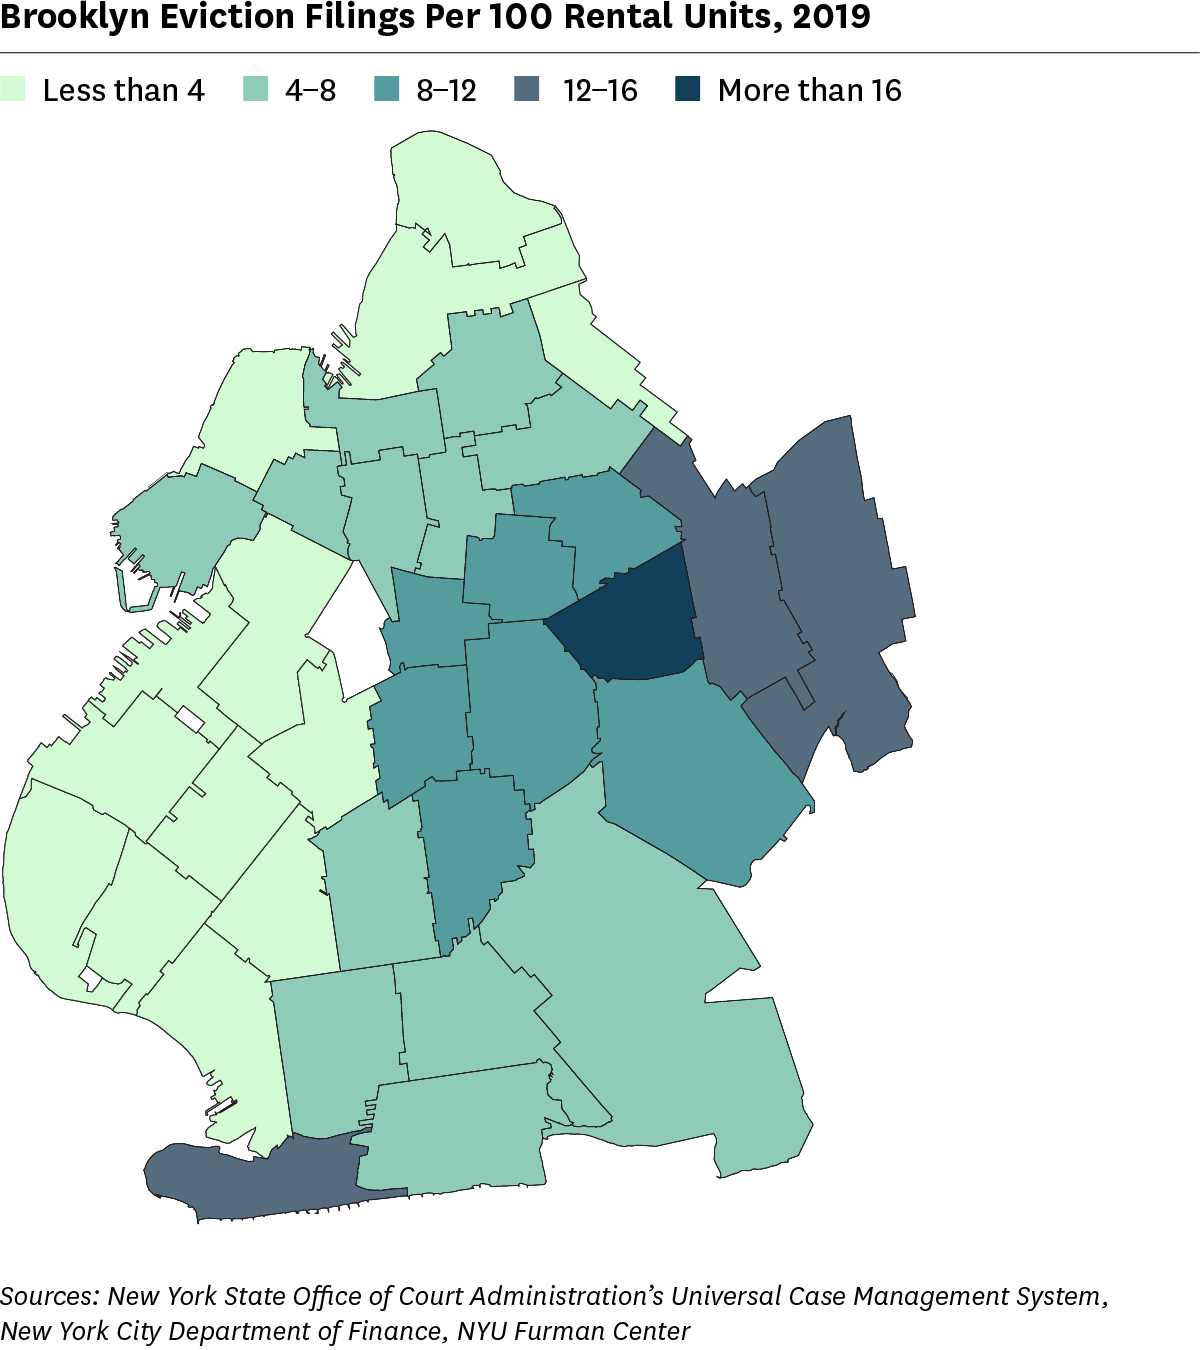
| Brooklyn Eviction Filings, 2019 | ||
|---|---|---|
| Total Filings | Filings Per 100 Units | |
| All Rental Units | 46,853 | 6.66 |
| Private Rental Units | 36,996 | 5.72 |
| Sources: New York State Office of Court Administration’s Universal Case Management System, New York City Department of Finance, NYU Furman Center | ||
| Manhattan Indicators | |||||||
|---|---|---|---|---|---|---|---|
| 2000 | 2006 | 2010 | 2018 | 2019 | 2000 Rank | 2018-19 Rank |
|
| Demographics | |||||||
| Population | 1,529,375 | 1,611,580 | 1,586,700 | 1,628,700 | - | - | - |
| Population aged 65+ | 12.2% | 12.7% | 13.5% | 16.5% | - | 2 | 1 |
| Foreign-born population | 29.4% | 28.7% | 28.5% | 29.2% | - | 3 | 4 |
| Households with children under 18 years old | 19.7% | 20.2% | 18.2% | 18.2% | - | 5 | 5 |
| Racial diversity index | 0.68 | 0.68 | 0.68 | 0.68 | - | 3 | 3 |
| Income diversity ratio | - | 8.4 | 8.0 | 8.9 | - | - | 1 |
| Median household income (2019$) | $73,910 | $75,640 | $73,720 | $86,470 | - | 2 | 1 |
| Poverty rate | 19.9% | 18.3% | 16.4% | 15.5% | - | 3 | 3 |
| Unemployment rate | 8.4% | 6.7% | 9.2% | 4.9% | - | 3 | 3 |
| Population aged 25+ with a bachelor's degree or higher | 49.4% | 55.2% | 58.1% | 61.4% | - | 1 | 1 |
| Population aged 25+ without a high school diploma | - | 16.2% | 14.4% | 12.3% | - | - | 4 |
| Housing Market and Conditions | |||||||
| Homeownership rate | 20.2% | 23.5% | 22.3% | 24.0% | - | 4 | 4 |
| Rental vacancy rate1 | - | - | 3.5% | 4.6% | - | - | 2 |
| Severe crowding rate (% of renter households)1 | - | - | 3.0% | 3.3% | - | - | 4 |
| Serious housing code violations (per 1,000 privately owned rental units)2 | - | 38.0 | 41.1 | 44.3 | 63.4 | - | 3 |
| Notices of foreclosure rate (per 1,000 1-4 unit and condo properties) | 3.6 | 2.0 | 8.1 | 2.2 | 2.9 | 5 | 5 |
| Home purchase loan rate (per 1,000 properties) | - | 34.8 | 19.4 | 15.7 | - | - | 5 |
| Land Use and Development | |||||||
| Population density (1,000 persons per square mile) | - | 71.1 | 70.0 | 71.9 | - | - | 1 |
| Units authorized by new residential building permits | 1,652 | 7,862 | 1,180 | 2,949 | 5,453 | 5 | 3 |
| Units issued new certificates of occupancy | 5,057 | 7,028 | 6,977 | 7,260 | 4,660 | 1 | 2 |
| Neighborhood Services and Conditions | |||||||
| Car-free commute (% of commuters) | 82.5% | 84.0% | 86.9% | 88.1% | - | 1 | 1 |
| Mean travel time to work (minutes) | 30.5 | 30.1 | 30.1 | 32.4 | - | 5 | 5 |
| Serious crime rate (per 1,000 residents) | 32.2 | 22.3 | 17.1 | 17.1 | 16.7 | 1 | 1 |
| Students performing at grade level in ELA, 4th grade | - | - | - | 57.7% | 59.2% | - | 1 |
| Students performing at grade level in math, 4th grade | - | - | - | 54.2% | 56.3% | - | 1 |
| Renters | |||||||
| Median rent, all (2019$) | $1,210 | $1,360 | $1,510 | $1,770 | - | 1 | 1 |
| Median rent, recent movers (2019$) | - | - | $2,270 | $2,450 | - | - | 1 |
| Rental units affordable at 80% AMI (% of recently available units)1 | - | - | 23.0% | 24.5% | - | - | 5 |
| Severely rent-burdened households1 | 20.0% | - | 22.7% | 22.4% | - | 5 | 5 |
| Severely rent-burdened households, low income households1 | - | - | 43.3% | 42.6% | - | - | 4 |
| Housing choice vouchers (% of occupied, privately owned rental units) | - | - | 4.1% | 3.7% | - | - | 4 |
| Public housing (% of rental units) | - | - | - | 9.5% | - | - | 2 |
|
1
These indicators use five-year American Community Survey (ACS) estimates. Data under the 2010 heading comes from the 2006–2010 ACS and data under the 2018 heading comes from the 2014–2018 ACS.
2
In 2019 some violations types were reclassified into the most serious class, resulting in an increase in this indicator.
|
|||||||
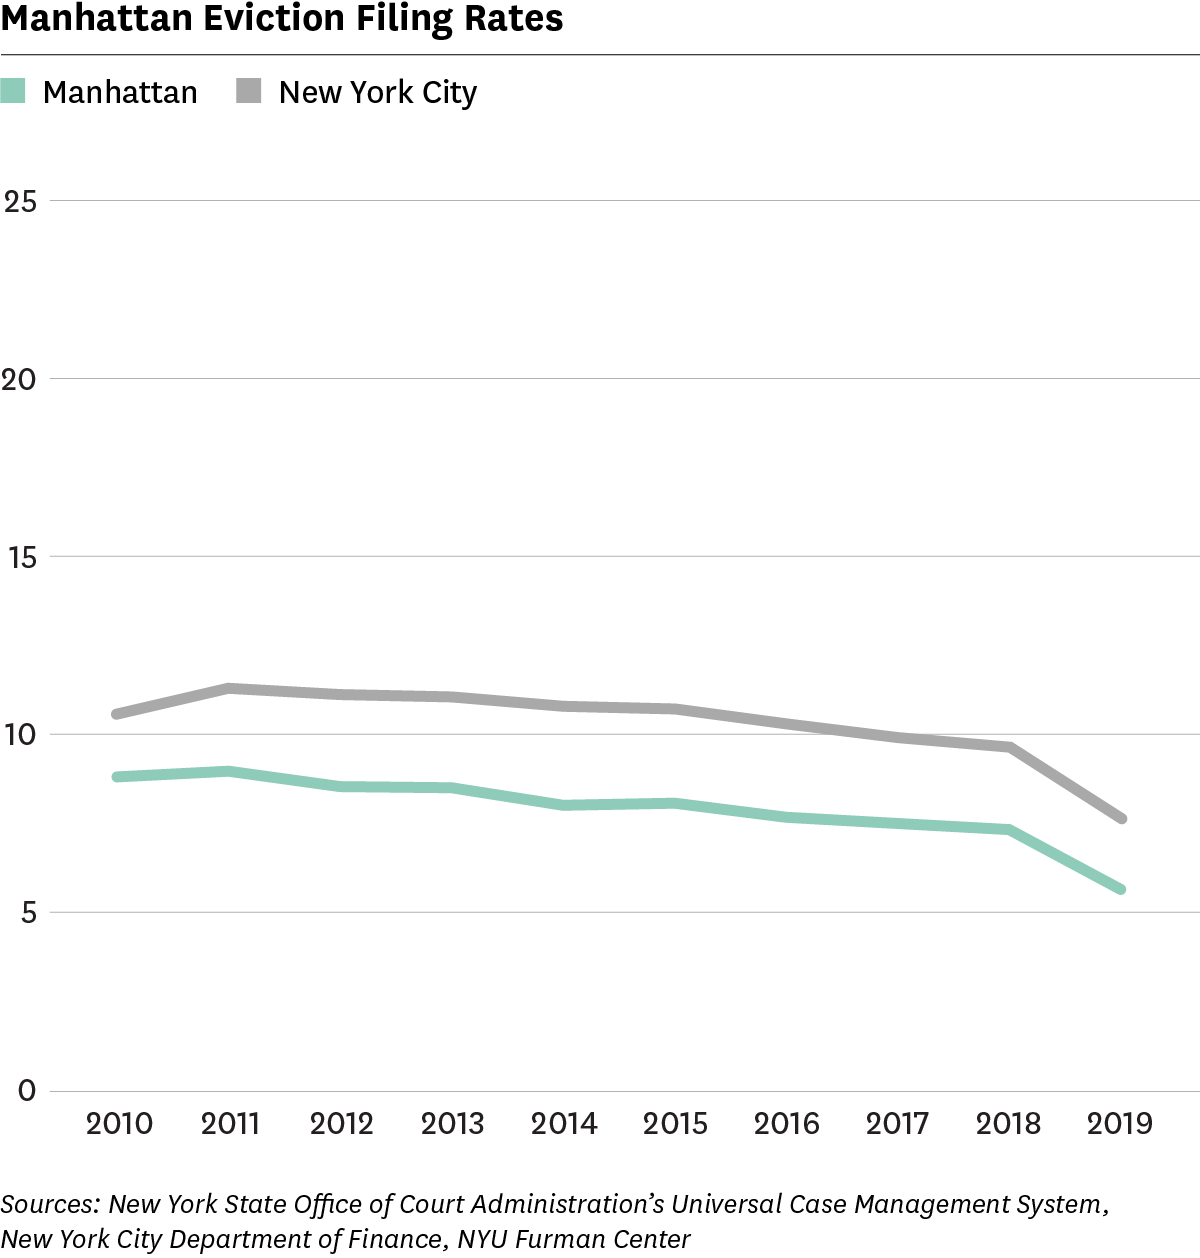
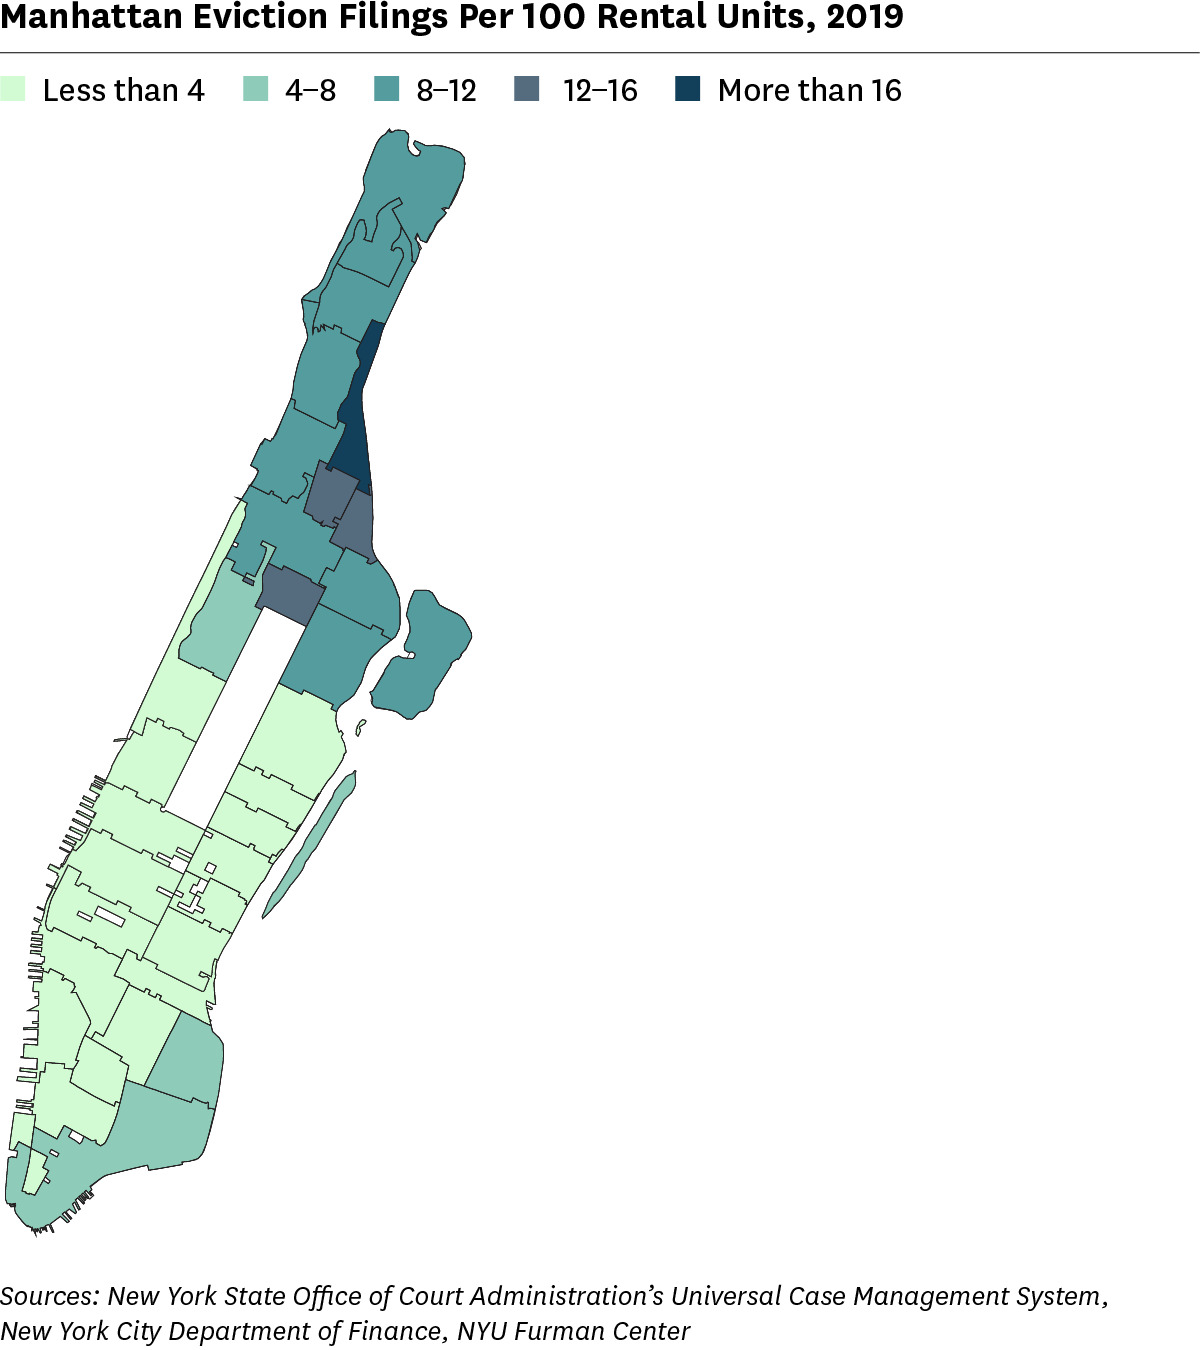
| Manhattan Eviction Filings, 2019 | ||
|---|---|---|
| Total Filings | Filings Per 100 Units | |
| All Rental Units | 32,475 | 5.46 |
| Private Rental Units | 23,643 | 4.37 |
| Sources: New York State Office of Court Administration’s Universal Case Management System, New York City Department of Finance, NYU Furman Center | ||
| Queens Indicators | |||||||
|---|---|---|---|---|---|---|---|
| 2000 | 2006 | 2010 | 2018 | 2019 | 2000 Rank | 2018-19 Rank |
|
| Demographics | |||||||
| Population | 2,242,159 | 2,255,180 | 2,233,840 | 2,278,910 | - | - | - |
| Population aged 65+ | 12.6% | 13.0% | 12.9% | 15.7% | - | 1 | 3 |
| Foreign-born population | 45.9% | 48.5% | 47.7% | 47.6% | - | 1 | 1 |
| Households with children under 18 years old | 35.9% | 34.3% | 33.7% | 30.0% | - | 4 | 3 |
| Racial diversity index | 0.76 | 0.76 | 0.76 | 0.76 | - | 1 | 1 |
| Income diversity ratio | - | 4.3 | 4.5 | 4.9 | - | - | 5 |
| Median household income (2019$) | $66,690 | $64,520 | $61,270 | $70,470 | - | 3 | 3 |
| Poverty rate | 14.6% | 12.2% | 15.0% | 11.5% | - | 4 | 4 |
| Unemployment rate | 7.7% | 7.5% | 11.1% | 5.2% | - | 4 | 2 |
| Population aged 25+ with a bachelor's degree or higher | 24.3% | 27.8% | 29.4% | 33.5% | - | 2 | 4 |
| Population aged 25+ without a high school diploma | - | 20.4% | 19.6% | 17.5% | - | - | 2 |
| Housing Market and Conditions | |||||||
| Homeownership rate | 42.8% | 47.0% | 43.8% | 45.3% | - | 2 | 2 |
| Rental vacancy rate1 | - | - | 3.2% | 2.8% | - | - | 4 |
| Severe crowding rate (% of renter households)1 | - | - | 4.5% | 5.0% | - | - | 2 |
| Serious housing code violations (per 1,000 privately owned rental units)2 | - | 23.7 | 22.8 | 22.5 | 34.6 | - | 5 |
| Notices of foreclosure rate (per 1,000 1-4 unit and condo properties) | 9.0 | 12.3 | 20.1 | 10.4 | 9.3 | 3 | 3 |
| Home purchase loan rate (per 1,000 properties) | - | 47.8 | 20.7 | 21.2 | - | - | 3 |
| Land Use and Development | |||||||
| Population density (1,000 persons per square mile) | - | 20.7 | 20.5 | 21.0 | - | - | 4 |
| Units authorized by new residential building permits | 3,207 | 7,210 | 1,471 | 4,523 | 5,216 | 2 | 4 |
| Units issued new certificates of occupancy | 2,181 | 5,743 | 3,657 | 6,317 | 4,654 | 3 | 3 |
| Neighborhood Services and Conditions | |||||||
| Car-free commute (% of commuters) | 53.6% | 57.9% | 57.8% | 59.0% | - | 4 | 4 |
| Mean travel time to work (minutes) | 42.2 | 41.8 | 41.1 | 45.2 | - | 4 | 2 |
| Serious crime rate (per 1,000 residents) | 19.1 | 12.4 | 10.3 | 8.5 | 8.2 | 4 | 4 |
| Students performing at grade level in ELA, 4th grade | - | - | - | 54.7% | 54.5% | - | 2 |
| Students performing at grade level in math, 4th grade | - | - | - | 53.3% | 55.7% | - | 2 |
| Renters | |||||||
| Median rent, all (2019$) | $1,180 | $1,340 | $1,430 | $1,610 | - | 2 | 2 |
| Median rent, recent movers (2019$) | - | - | $1,570 | $1,800 | - | - | 3 |
| Rental units affordable at 80% AMI (% of recently available units)1 | - | - | 50.4% | 50.1% | - | - | 3 |
| Severely rent-burdened households1 | 22.0% | - | 28.0% | 29.7% | - | 3 | 4 |
| Severely rent-burdened households, low income households1 | - | - | 46.2% | 46.5% | - | - | 1 |
| Housing choice vouchers (% of occupied, privately owned rental units) | - | - | 2.8% | 2.4% | - | - | 5 |
| Public housing (% of rental units) | - | - | - | 3.6% | - | - | 5 |
|
1
These indicators use five-year American Community Survey (ACS) estimates. Data under the 2010 heading comes from the 2006–2010 ACS and data under the 2018 heading comes from the 2014–2018 ACS.
2
In 2019 some violations types were reclassified into the most serious class, resulting in an increase in this indicator.
|
|||||||
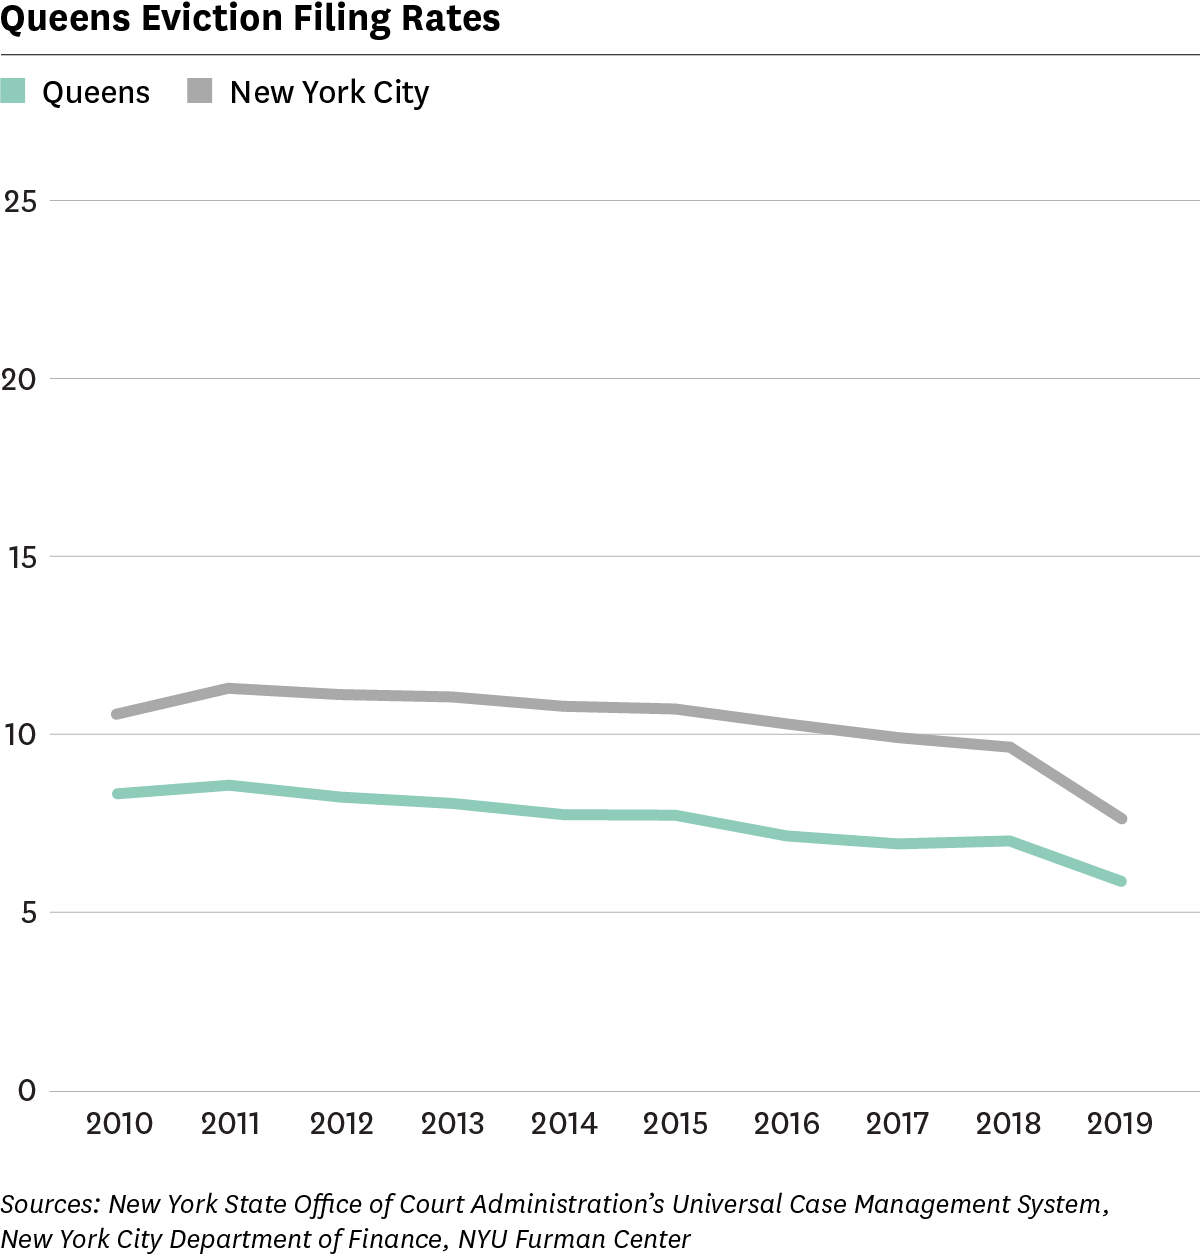
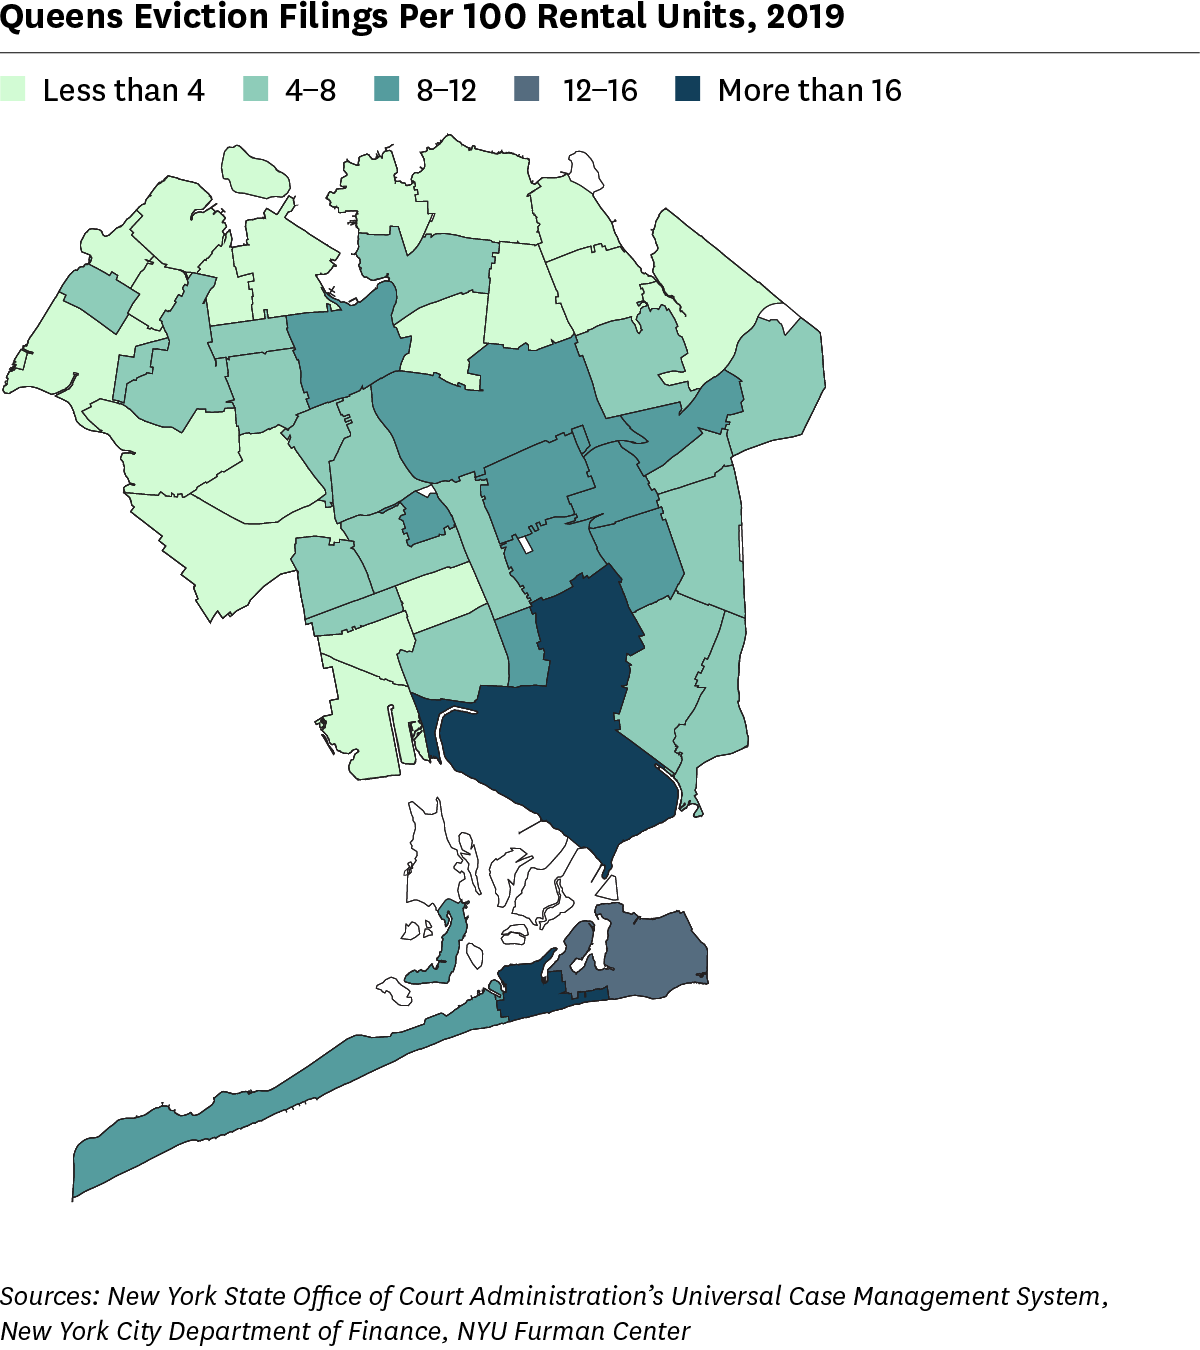
| Queens Eviction Filings, 2019 | ||
|---|---|---|
| Total Filings | Filings Per 100 Units | |
| All Rental Units | 25,481 | 5.71 |
| Private Rental Units | 22,740 | 5.27 |
| Sources: New York State Office of Court Administration’s Universal Case Management System, New York City Department of Finance, NYU Furman Center | ||
| Staten Island Indicators | |||||||
|---|---|---|---|---|---|---|---|
| 2000 | 2006 | 2010 | 2018 | 2019 | 2000 Rank | 2018-19 Rank |
|
| Demographics | |||||||
| Population | 443,728 | 477,377 | 469,363 | 476,179 | - | - | - |
| Population aged 65+ | 11.6% | 11.8% | 12.7% | 16.2% | - | 3 | 2 |
| Foreign-born population | 16.4% | 20.9% | 21.4% | 25.2% | - | 5 | 5 |
| Households with children under 18 years old | 38.5% | 38.7% | 36.8% | 34.0% | - | 2 | 2 |
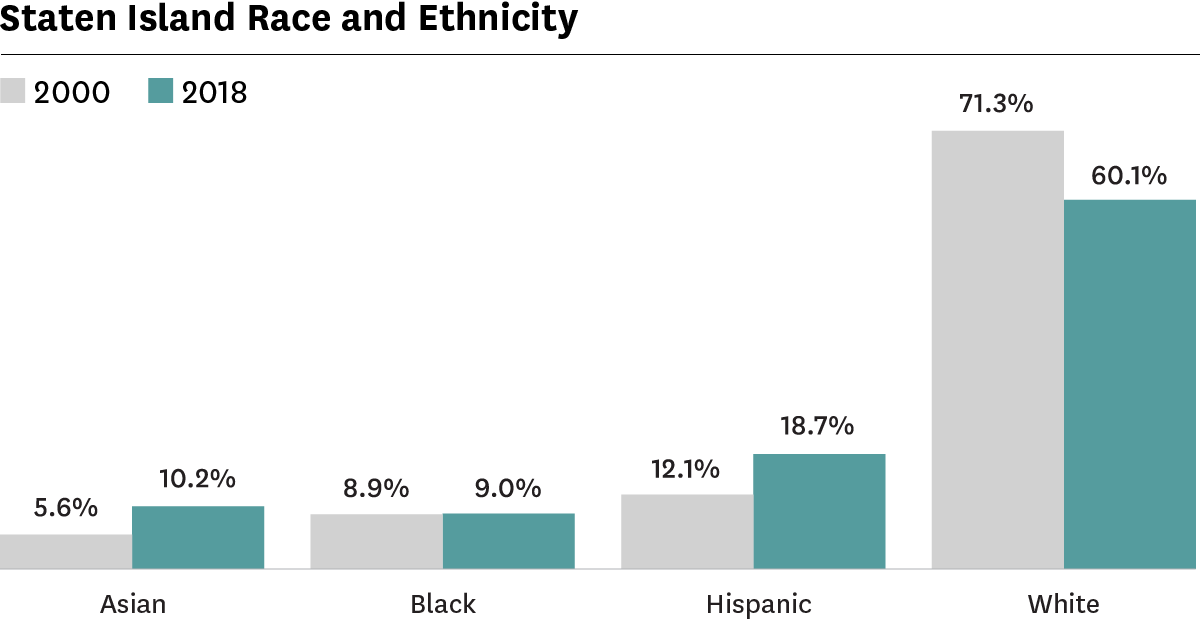
| Racial diversity index | 0.47 | 0.52 | 0.54 | 0.58 | - | 5 | 5 |
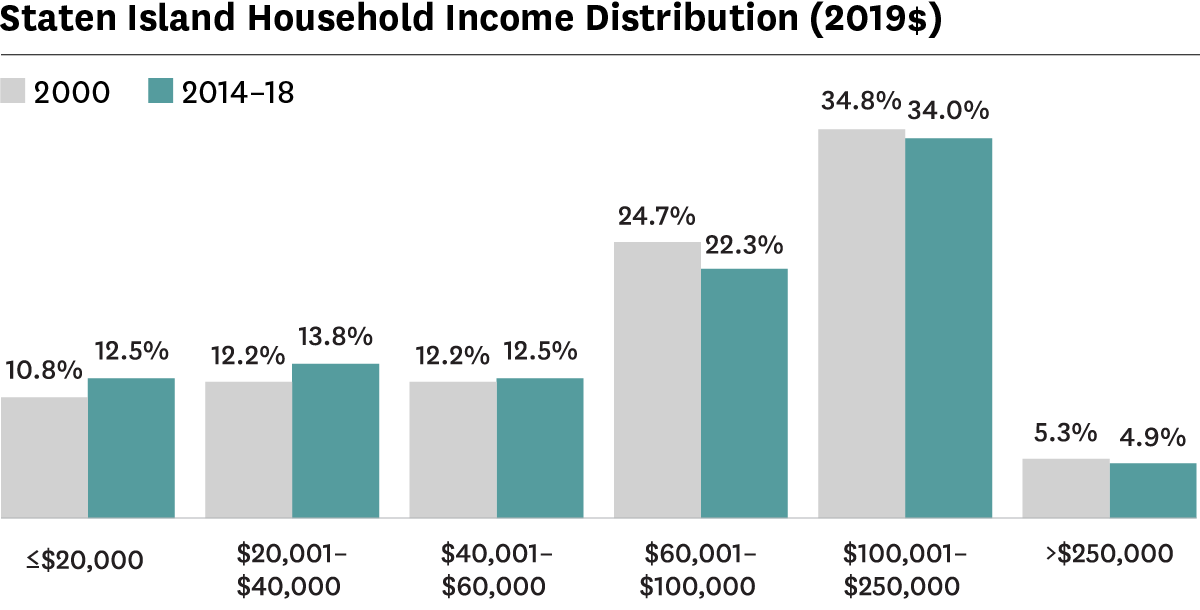
| Income diversity ratio | - | 4.3 | 5.3 | 5.2 | - | - | 4 |
| Median household income (2019$) | $86,500 | $86,490 | $81,490 | $83,520 | - | 1 | 2 |
| Poverty rate | 10.0% | 9.2% | 11.8% | 11.4% | - | 5 | 5 |
| Unemployment rate | 5.9% | 5.4% | 9.1% | 4.1% | - | 5 | 5 |
| Population aged 25+ with a bachelor's degree or higher | 23.2% | 26.8% | 30.7% | 34.3% | - | 3 | 3 |
| Population aged 25+ without a high school diploma | - | 12.1% | 12.0% | 12.3% | - | - | 4 |
| Housing Market and Conditions | |||||||
| Homeownership rate | 63.8% | 72.0% | 69.6% | 69.2% | - | 1 | 1 |
| Rental vacancy rate1 | - | - | 7.6% | 6.8% | - | - | 1 |
| Severe crowding rate (% of renter households)1 | - | - | 1.9% | 2.6% | - | - | 5 |
| Serious housing code violations (per 1,000 privately owned rental units)2 | - | 19.0 | 37.2 | 30.5 | 38.3 | - | 4 |
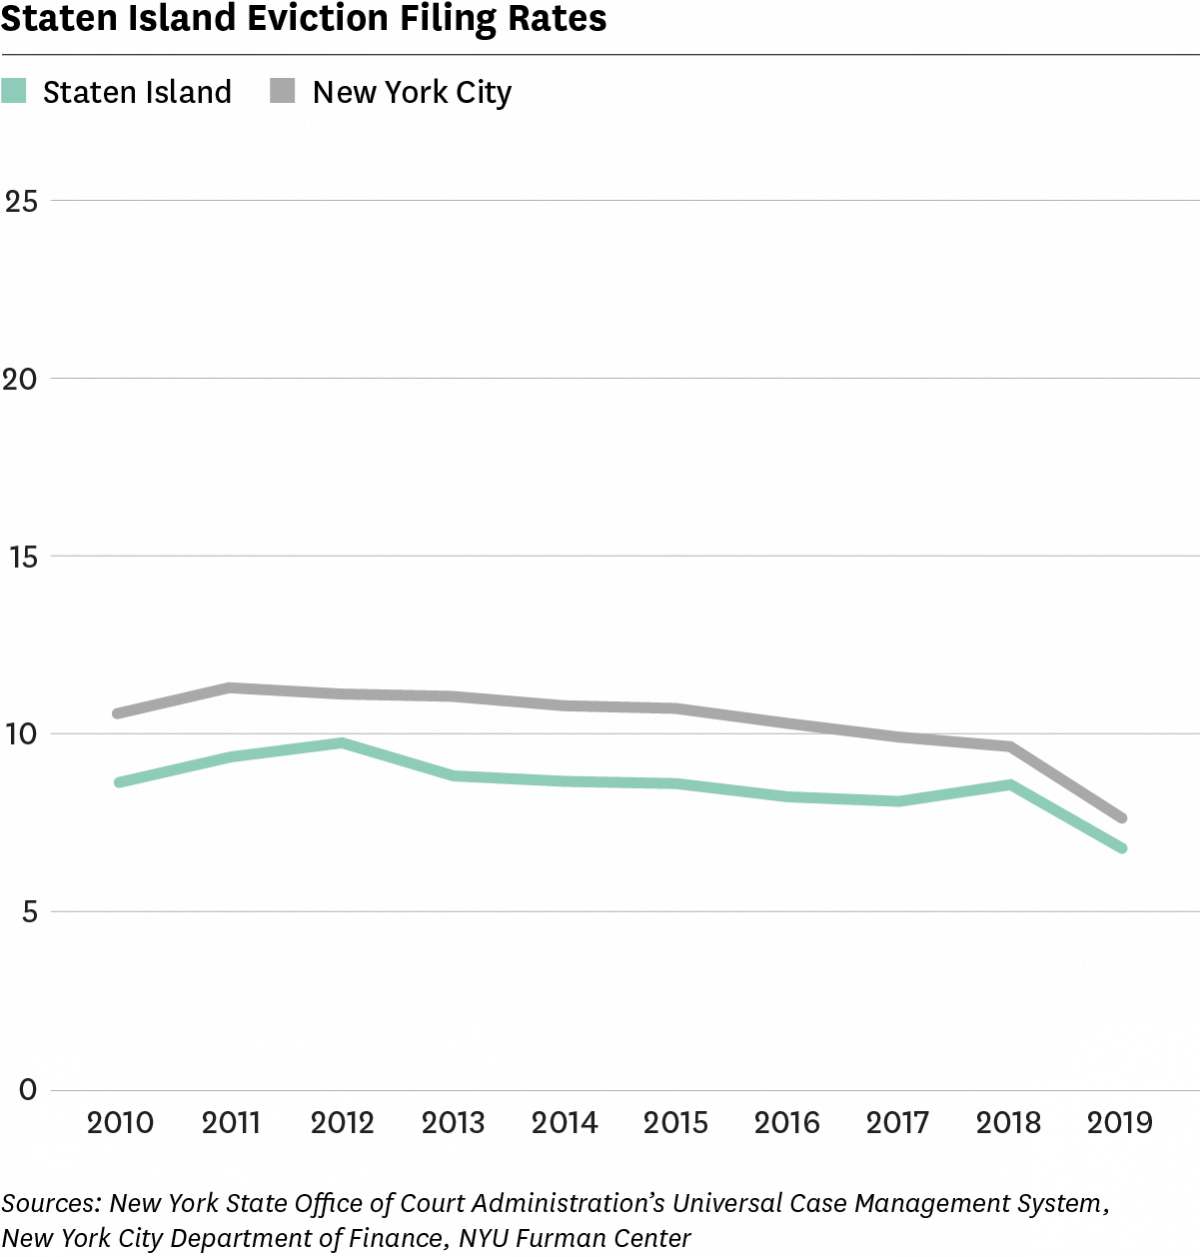
| Notices of foreclosure rate (per 1,000 1-4 unit and condo properties) | 6.8 | 8.5 | 14.6 | 9.2 | 7.8 | 4 | 4 |
| Home purchase loan rate (per 1,000 properties) | - | 41.9 | 20.4 | 30.4 | - | - | 1 |
| Land Use and Development | |||||||
| Population density (1,000 persons per square mile) | - | 8.3 | 8.2 | 8.3 | - | - | 5 |
| Units authorized by new residential building permits | 2,660 | 954 | 447 | 591 | 676 | 4 | 5 |
| Units issued new certificates of occupancy | 3,364 | 1,856 | 775 | 861 | 645 | 2 | 5 |
| Neighborhood Services and Conditions | |||||||
| Car-free commute (% of commuters) | 31.6% | 35.8% | 33.0% | 33.5% | - | 5 | 5 |
| Mean travel time to work (minutes) | 43.9 | 42.6 | 40.1 | 47.1 | - | 1 | 1 |
| Serious crime rate (per 1,000 residents) | 10.5 | 7.6 | 6.3 | 5.8 | 4.9 | 5 | 5 |
| Students performing at grade level in ELA, 4th grade | - | - | - | 57.3% | 53.5% | - | 3 |
| Students performing at grade level in math, 4th grade | - | - | - | 49.7% | 54.8% | - | 3 |
| Renters | |||||||
| Median rent, all (2019$) | $1,130 | $1,250 | $1,320 | $1,310 | - | 3 | 4 |
| Median rent, recent movers (2019$) | - | - | $1,440 | $1,440 | - | - | 4 |
| Rental units affordable at 80% AMI (% of recently available units)1 | - | - | 62.5% | 75.8% | - | - | 2 |
| Severely rent-burdened households1 | 21.5% | - | 30.7% | 32.9% | - | 4 | 2 |
| Severely rent-burdened households, low income households1 | - | - | 44.8% | 44.1% | - | - | 3 |
| Housing choice vouchers (% of occupied, privately owned rental units) | - | - | 5.4% | 6.1% | - | - | 3 |
| Public housing (% of rental units) | - | - | - | 8.7% | - | - | 3 |
|
1
These indicators use five-year American Community Survey (ACS) estimates. Data under the 2010 heading comes from the 2006–2010 ACS and data under the 2018 heading comes from the 2014–2018 ACS.
2
In 2019 some violations types were reclassified into the most serious class, resulting in an increase in this indicator.
|
|||||||
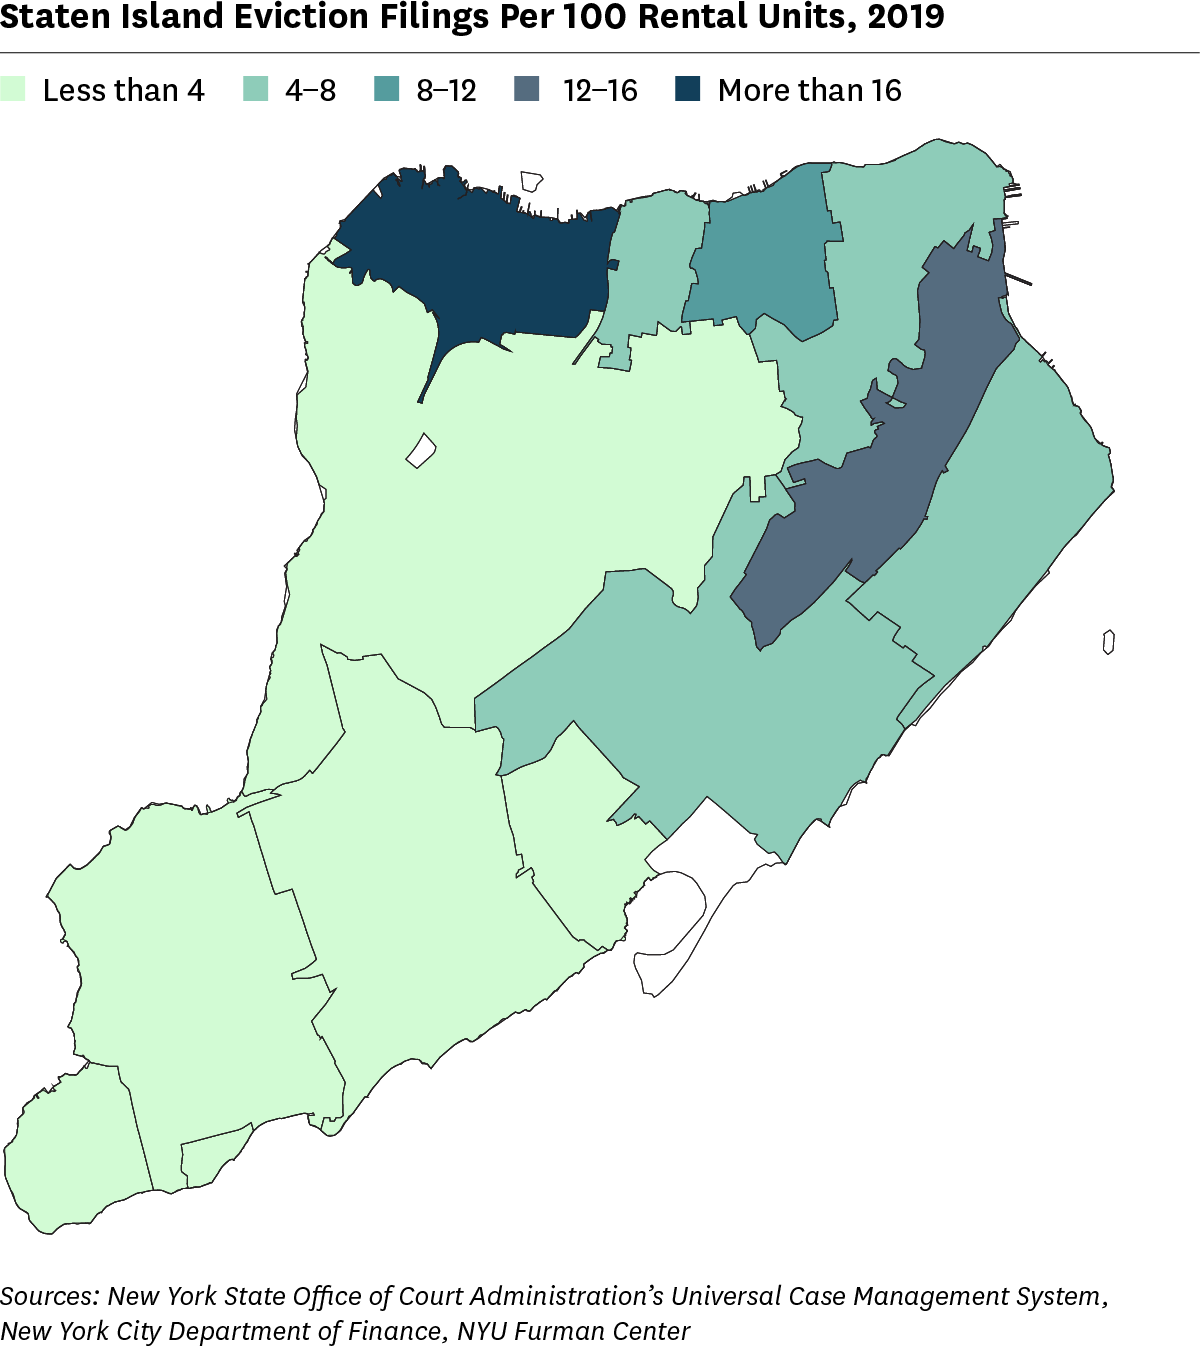
| Staten Island Eviction Filings, 2019 | ||
|---|---|---|
| Total Filings | Filings Per 100 Units | |
| All Rental Units | 3,943 | 6.59 |
| Private Rental Units | 2,992 | 5.40 |
| Sources: New York State Office of Court Administration’s Universal Case Management System, New York City Department of Finance, NYU Furman Center | ||
All content © 2005 – 2024 Furman Center for Real Estate and Urban Policy | Top of page | Contact Us