| Indicator | 2000 | 2006 | 2010 | 2019 | 2021 | 2022 |
|---|---|---|---|---|---|---|
| Population | ||||||
| Born in New York State | 32.5% | 36.2% | 34.0% | 37.9% | ||
| Disabled population | 5.5% | 4.2% | 2.6% | |||
| Foreign-born population | 61.0% | 60.7% | 54.7% | 52.3% | 50.5% | |
| Population | 130,166 | 128,673 | 125,229 | 136,058 | 149,487 | |
| Population aged 65+ | 11.0% | 10.5% | 9.7% | 13.3% | 13.1% | |
| Households | ||||||
| Households with children under 18 years old | 29.9% | 28.1% | 26.0% | 24.3% | 20.8% | |
| Single-person households | 31.7% | 32.2% | 30.0% | 37.7% | ||
| Race and Ethnicity | ||||||
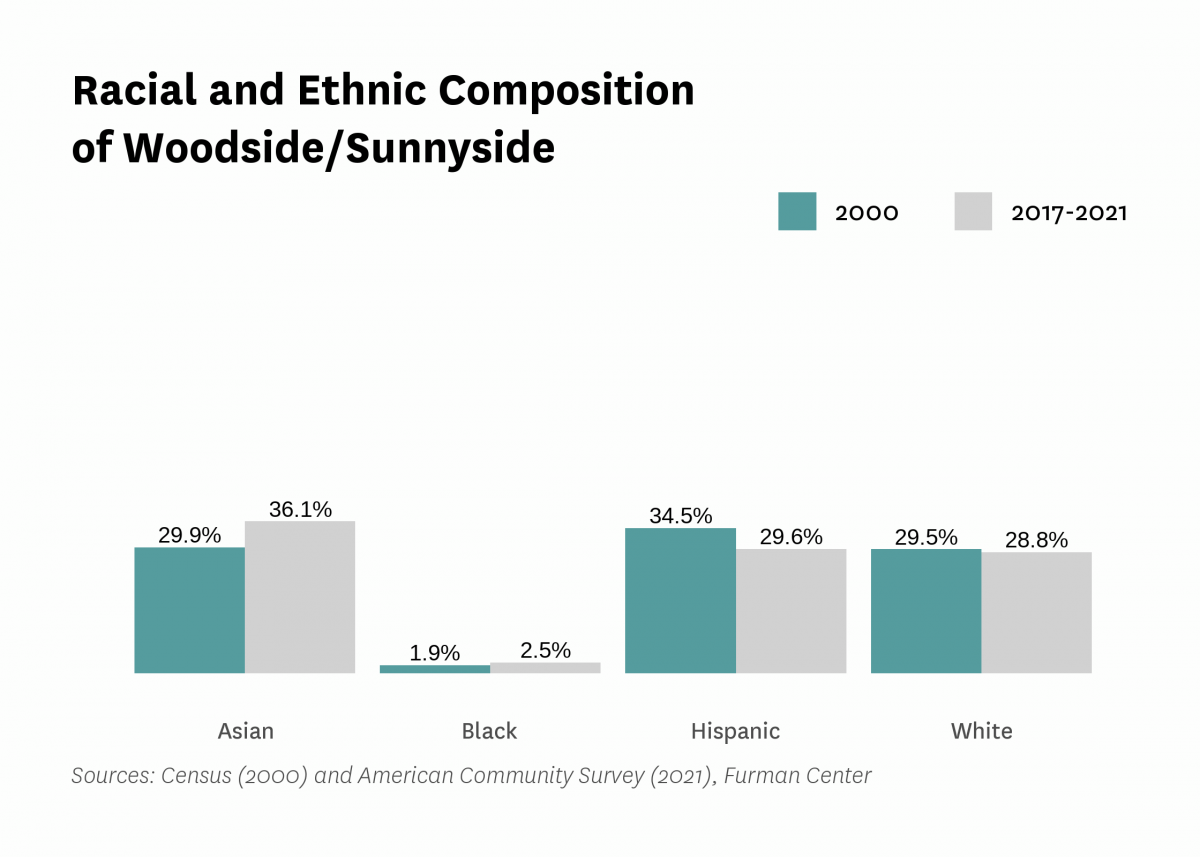
| Percent Asian | 29.9% | 33.0% | 34.8% | 37.1% | 36.1% | |
| Percent Black | 1.9% | 2.2% | 1.5% | 1.7% | 2.5% | |
| Percent Hispanic | 34.5% | 34.6% | 34.1% | 29.3% | 29.6% | |
| Percent white | 29.5% | 28.8% | 27.4% | 28.2% | 28.8% | |
| Racial diversity index | 0.70 | 0.69 | 0.69 | 0.70 | 0.70 | |
| Income and Poverty | ||||||
| Income diversity ratio | 3.5 | 3.7 | 4.8 | 4.6 | ||
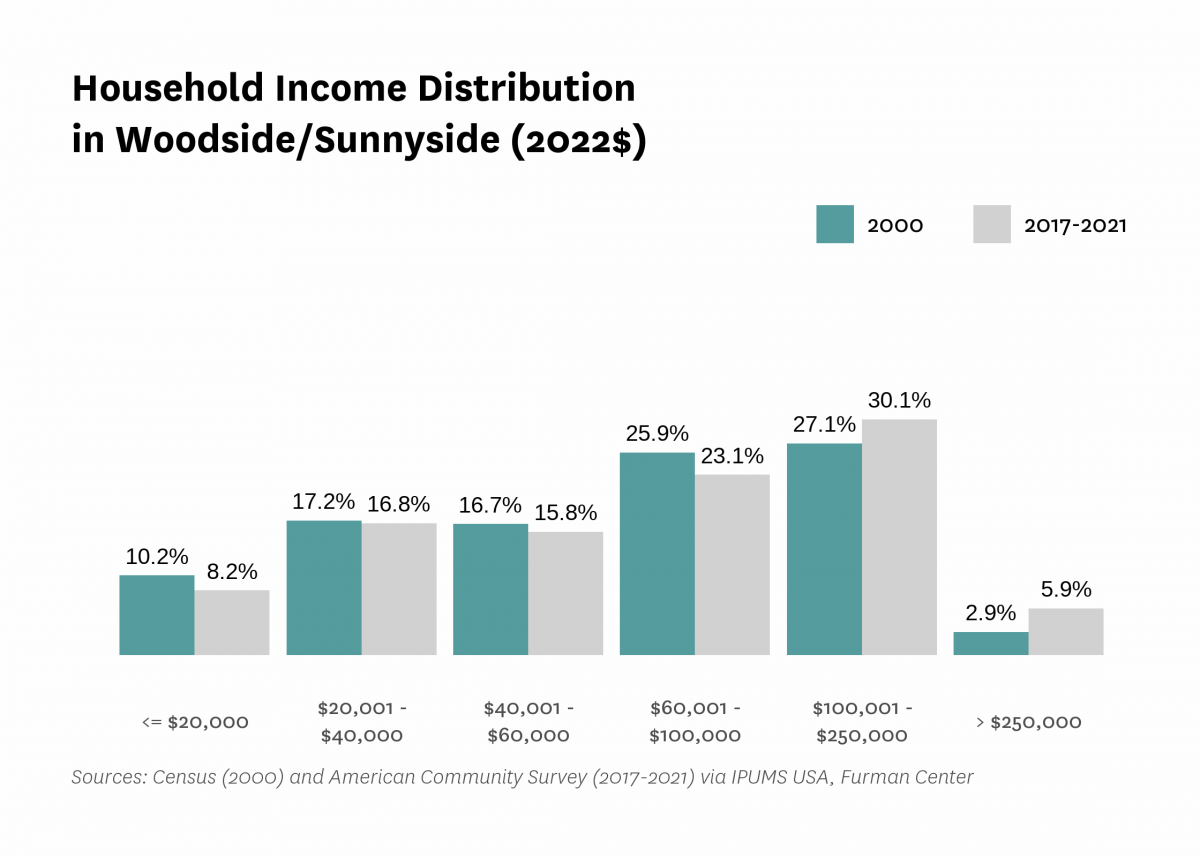
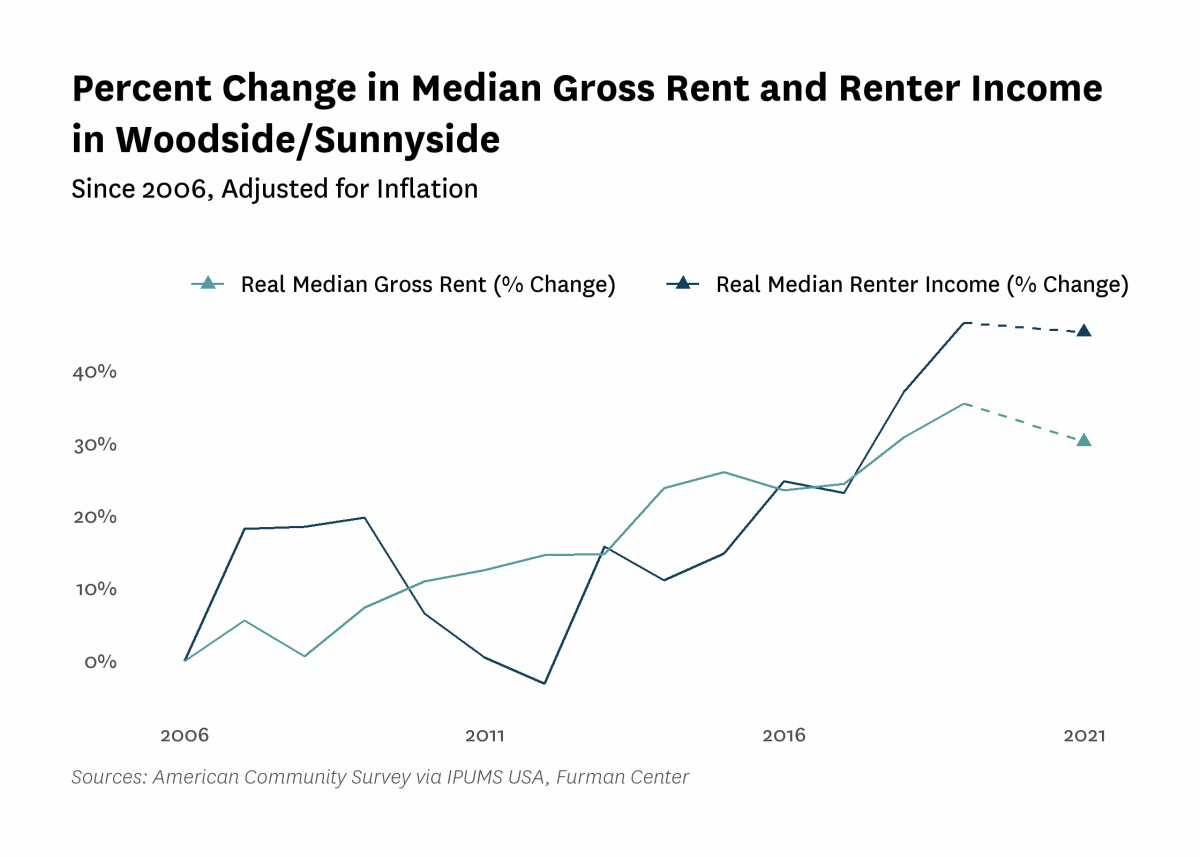
| Median household income (2022$) | $70,090 | $62,820 | $67,210 | $90,210 | $85,630 | |
| Median household income, homeowners (2022$) | $78,810 | $103,780 | $103,910 | $93,470 | ||
| Median household income, renters (2022$) | $57,790 | $61,570 | $84,760 | $84,000 | ||
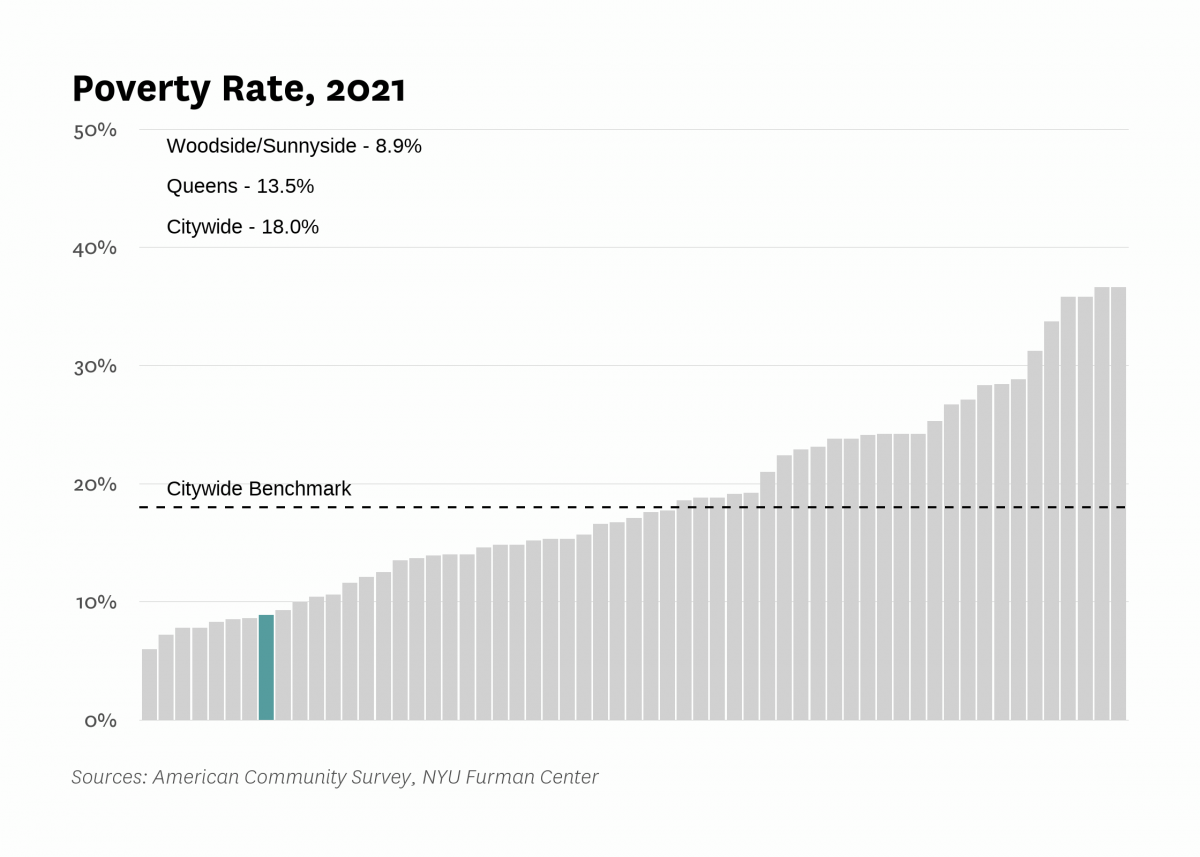
| Poverty rate | 16.4% | 18.1% | 12.2% | 9.2% | 8.9% | |
| Poverty rate, population aged 65+ | 13.5% | 12.9% | 13.5% | 15.0% | ||
| Poverty rate, population under 18 years old | 25.2% | 18.5% | 7.6% | 6.0% | ||
| Labor Market | ||||||
| Labor force participation rate | 65.3% | 68.7% | 69.8% | 69.7% | ||
| Population aged 25+ without a high school diploma | 21.8% | 19.8% | 14.7% | 13.0% | ||
| Unemployment rate | 7.40% | 8.68% | 7.41% | 3.92% | 8.33% | |
| Indicator | 2000 | 2006 | 2010 | 2019 | 2021 | 2022 |
|---|---|---|---|---|---|---|
| Housing Stock | ||||||
| Homeownership rate | 25.2% | 29.5% | 24.2% | 26.7% | 25.3% | |
| Housing units | 51,933 | 52,558 | 64,250 | 72,484 | ||
| Rental vacancy rate | 2.3% | 3.5% | 3.5% | |||
| Serious housing code violations (per 1,000 privately owned rental units) | 28.2 | 15.9 | 23.4 | 28.5 | 33.2 | |
| Severe crowding rate (% of renter households) | 6.5% | 5.5% | 5.4% | |||
| Total housing code violations (per 1,000 privately owned rental units) | 173.9 | 108.2 | 83.1 | 130.9 | 133.2 | |
| Finance - Distress | ||||||
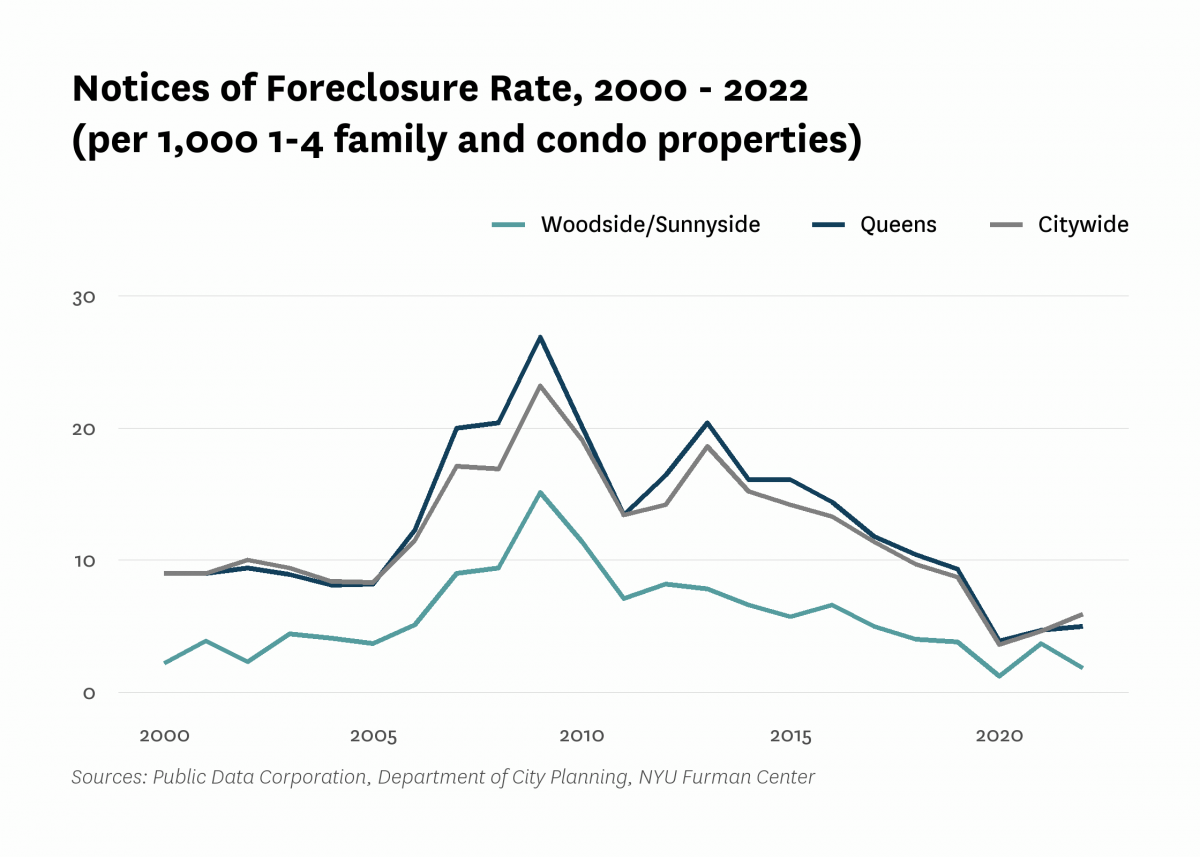
| Notices of foreclosure rate (per 1,000 1-4 family and condo properties) | 2.2 | 5.1 | 11.4 | 3.8 | 3.7 | 1.8 |
| Notices of foreclosure, all residential properties | 17 | 41 | 115 | 39 | 47 | 25 |
| Notices of foreclosure, initial, 1-4 family and condo properties | 13 | 32 | 85 | 18 | 32 | 7 |
| Notices of foreclosure, repeat, 1-4 family and condo properties | 2 | 5 | 18 | 20 | 11 | 14 |
| Pre-foreclosure notice rate (per 1,000 1-4 family and condo properties) | 18.6 | 9.7 | 17.9 | |||
| Pre-foreclosure notices, 1-4 family and condo properties | 188 | 116 | 214 | |||
| Properties entering REO, 1-4 family | 2 | 2 | 4 | |||
| Finance - Lending | ||||||
| FHA/VA-backed home purchase loans (% of home purchase loans) | 0.0% | 11.5% | 0.2% | 1.1% | ||
| Higher-cost home purchase loans (% of home purchase loans) | 10.9% | 0.4% | 1.4% | 3.5% | ||
| Higher-cost refinance loans (% of refinance loans) | 17.5% | 1.3% | 5.3% | 1.4% | ||
| Home purchase loan rate (per 1,000 properties) | 45.5 | 25.9 | 23.5 | 43.9 | ||
| Home purchase loans in LMI tracts (% of home purchase loans) | 35.9% | 11.9% | 17.2% | 14.9% | ||
| Home purchase loans to LMI borrowers (% of home purchase loans) | 9.0% | 26.4% | 6.0% | 7.5% | ||
| Refinance loan rate (per 1,000 properties) | 25.1 | 14.6 | 10.4 | 30.5 | ||
| Sales - Volume | ||||||
| Sales volume, 1 family building | 76 | 103 | 46 | 39 | 48 | 45 |
| Sales volume, 2-4 family building | 154 | 244 | 77 | 66 | 78 | 108 |
| Sales volume, 5+ family building | 23 | 51 | 18 | 22 | 26 | 22 |
| Sales volume, condominium | 16 | 50 | 304 | 127 | 757 | 447 |
| Sales volume, all property types | 269 | 448 | 445 | 254 | 909 | 622 |
| Sales - Median Prices | ||||||
| Median sales price per unit, 1 family building (2022$) | $418,900 | $815,050 | $642,200 | $930,990 | $923,090 | $899,000 |
| Median sales price per unit, 2-4 family building (2022$) | $253,260 | $484,810 | $350,880 | $550,420 | $529,180 | $505,830 |
| Median sales price per unit, 5+ family building (2022$) | $90,280 | $175,660 | $164,580 | $334,490 | $247,570 | $231,850 |
| Median sales price per unit, condominium (2022$) | $187,780 | $504,490 | $733,140 | $1,003,460 | $1,069,470 | $1,066,320 |
| Sales - Housing Price Index | ||||||
| Index of housing price appreciation, 1 family building | 100.0 | 231.3 | 203.5 | 372.0 | 387.5 | 397.1 |
| Index of housing price appreciation, 2-4 family building | 100.0 | 224.4 | 161.7 | 313.2 | 363.8 | 384.5 |
| Index of housing price appreciation, 5+ family building | 100.0 | 216.0 | 210.6 | 515.8 | 459.0 | 486.1 |
| Index of housing price appreciation, condominium | 100.0 | 265.4 | 207.0 | 385.5 | 365.5 | 402.7 |
| Index of housing price appreciation, all property types | 100.0 | 229.6 | 186.8 | 362.0 | 351.3 | 380.6 |
| Subsidized Housing | ||||||
| Total number of subsidized properties (properties) | 37 | |||||
| HUD Financing or Insurance (properties) | 2 | |||||
| HUD Financing or Insurance (units) | 94 | |||||
| HUD Project-based Rental Assistance Program (properties) | 2 | |||||
| HUD Project-based Rental Assistance Program (units) | 450 | |||||
| Low Income Housing Tax Credit (properties) | 6 | |||||
| Low Income Housing Tax Credit (units) | 2,091 | |||||
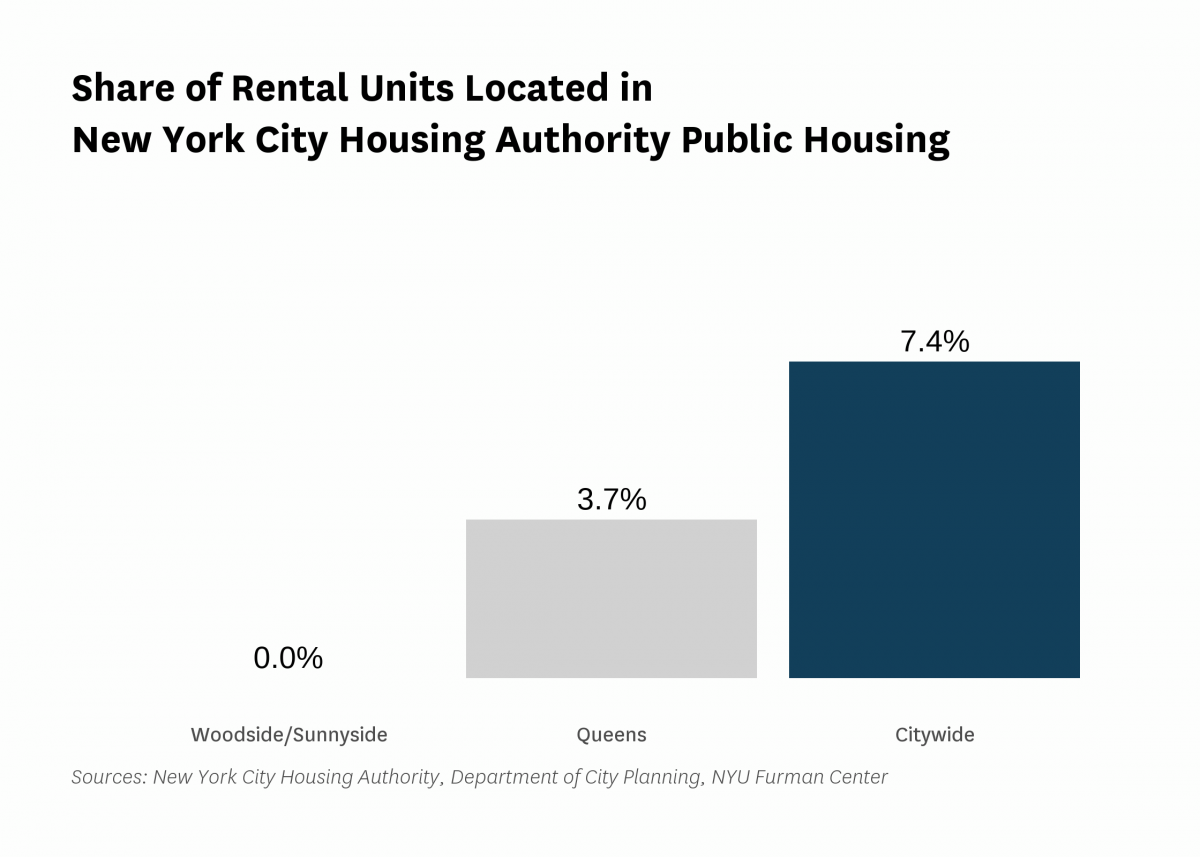
| Public Housing (properties) | 0 | |||||
| Public Housing (units) | 0 | |||||
| Mitchell-Lama (properties) | 2 | |||||
| Mitchell-Lama (units) | 988 | |||||
| 421-a Tax Exemption (properties) | 130 | |||||
| 421-a Tax Exemption (units) | 11,510 | |||||
| 420-c Tax Exemption (properties) | 0 | |||||
| 420-c Tax Exemption (units) | 0 | |||||
| NYC Housing Production Programs and Zoning Incentives or Requirements (properties) | 24 | |||||
| Eligible to expire from housing programs between 2023 and 2028 (properties) | 2 | |||||
| Eligible to expire from housing programs between 2023 and 2028 (units) | 388 | |||||
| Eligible to expire from housing programs between 2029 and 2038 (properties) | 0 | |||||
| Eligible to expire from housing programs between 2029 and 2038 (units) | 0 | |||||
| Eligible to expire from housing programs in 2039 and later (properties) | 8 | |||||
| Eligible to expire from housing programs in 2039 and later (units) | 3,122 | |||||
| Indicator | 2000 | 2006 | 2010 | 2019 | 2021 | 2022 |
|---|---|---|---|---|---|---|
| Density | ||||||
| Population density (1,000 persons per square mile) | 21.5 | 20.9 | 22.7 | 25.0 | ||
| Development | ||||||
| Units authorized by new residential building permits | 116 | 0 | 747 | 1,826 | 1,463 | 5,418 |
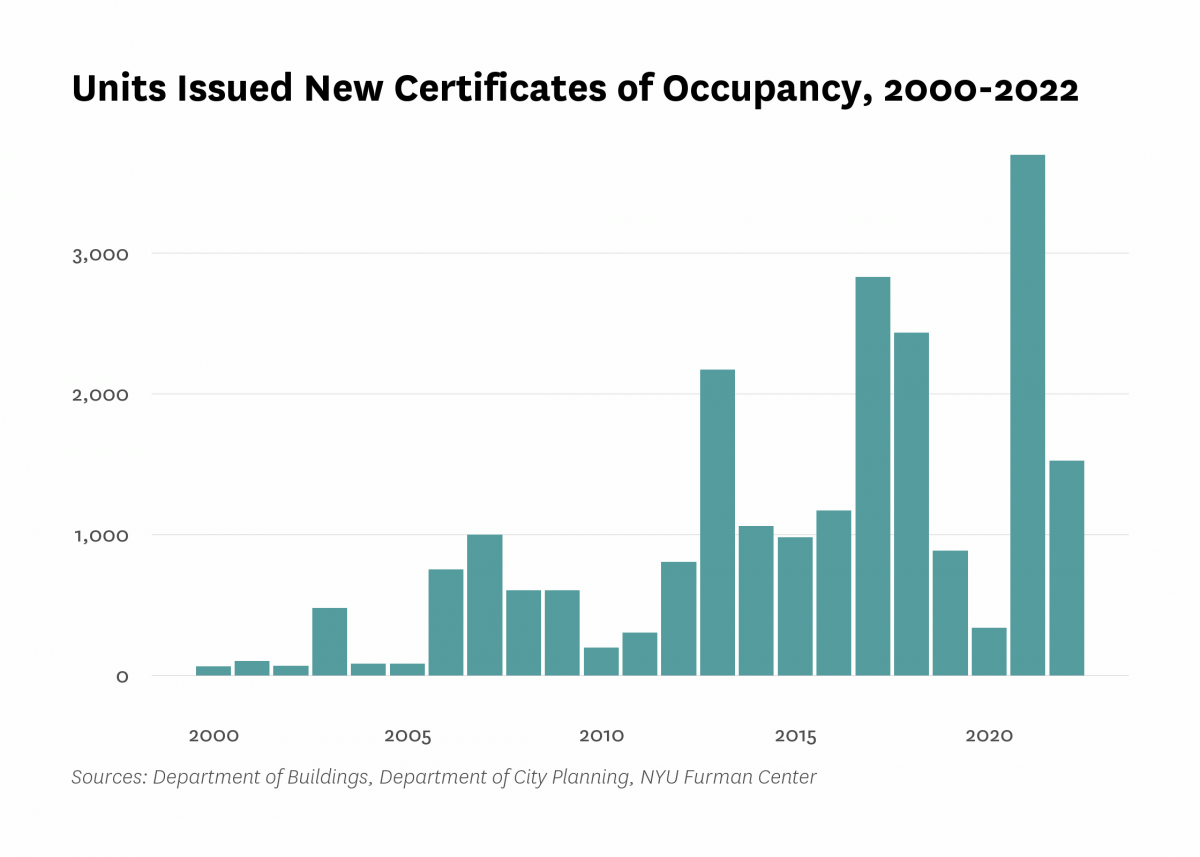
| Units issued new certificates of occupancy | 66 | 754 | 200 | 886 | 3,697 | 1,525 |
| Indicator | 2000 | 2006 | 2010 | 2019 | 2021 | 2022 |
|---|---|---|---|---|---|---|
| Commute | ||||||
| Car-free commute (% of commuters) | 73.8% | 74.1% | 76.6% | 78.9% | 70.9% | |
| Mean travel time to work (minutes) | 37.2 | 38.2 | 35.6 | 37.3 | 34.3 | |
| Crime and Incarceration | ||||||
| Serious crime rate (per 1,000 residents) | 14.1 | 11.1 | 8.7 | 8.8 | 11.0 | |
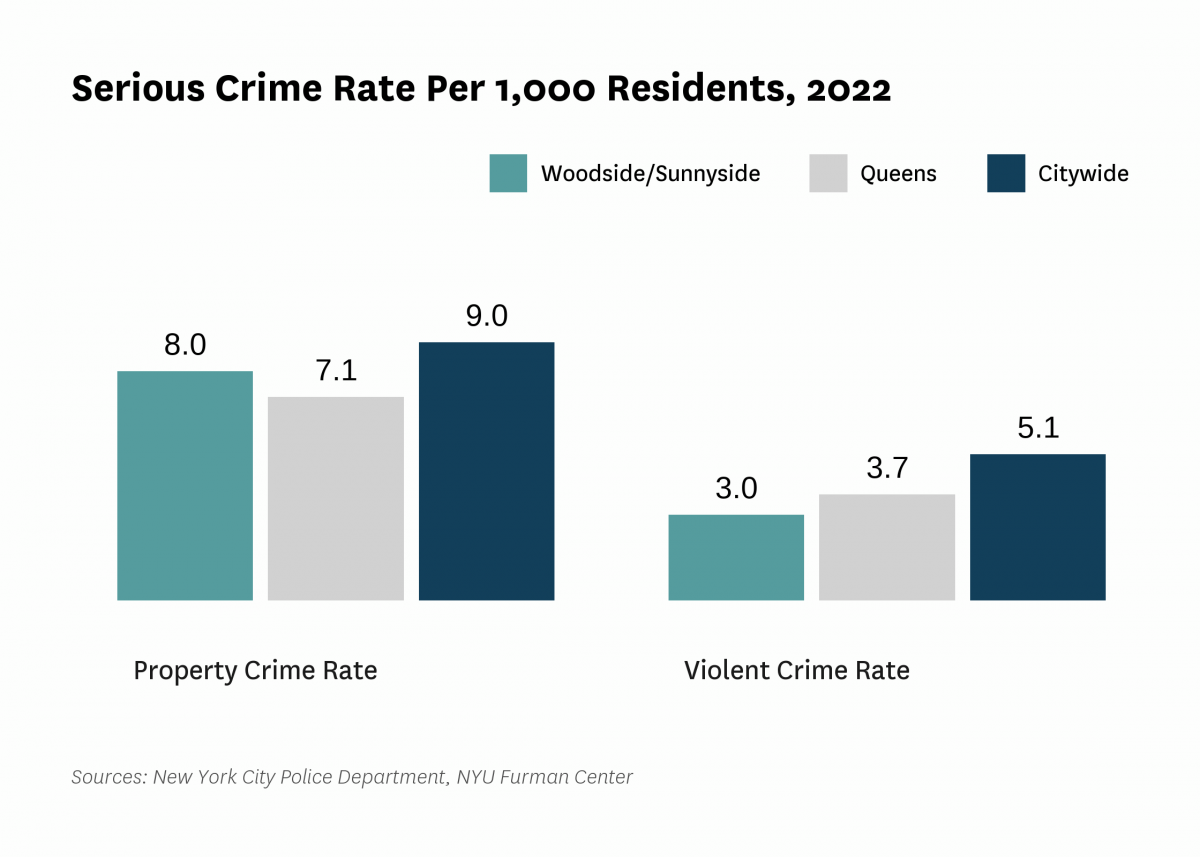
| Serious crime rate, property (per 1,000 residents) | 11.1 | 8.1 | 6.4 | 6.4 | 8.0 | |
| Serious crime rate, violent (per 1,000 residents) | 3.0 | 3.0 | 2.3 | 2.4 | 3.0 | |
| Schools | ||||||
| Students performing at grade level in English language arts, 4th grade | 61.5% | 60.2% | ||||
| Students performing at grade level in math, 4th grade | 63.0% | 57.7% | ||||
| Indicator | 2000 | 2006 | 2010 | 2019 | 2021 | 2022 |
|---|---|---|---|---|---|---|
| Median Rent | ||||||
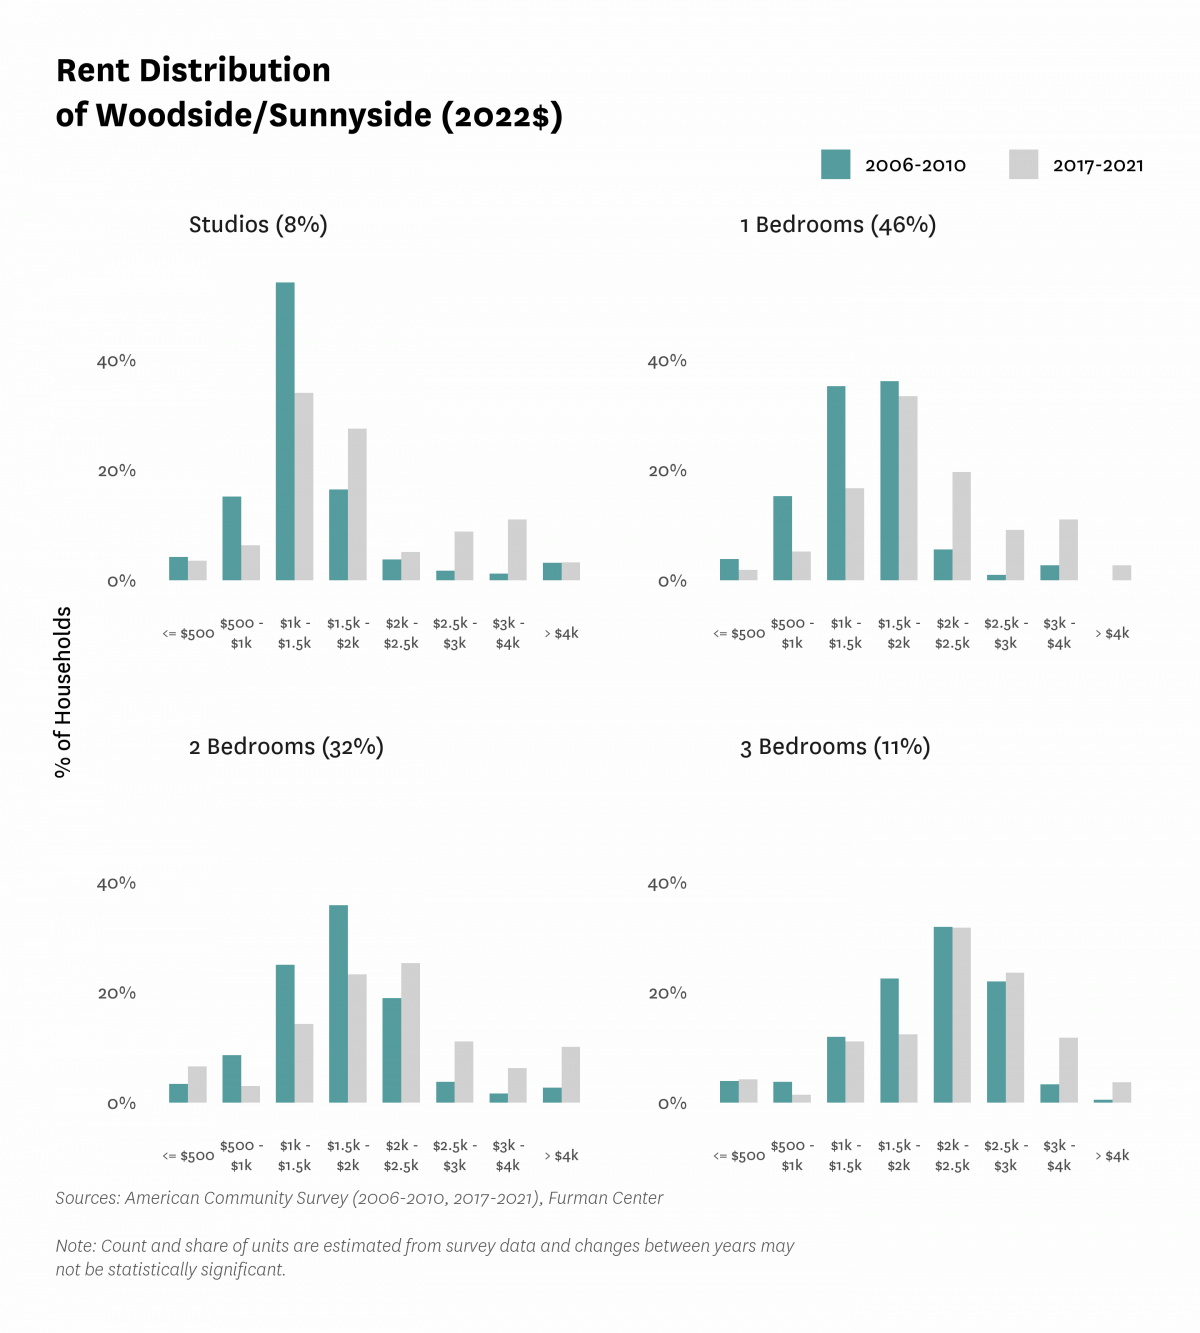
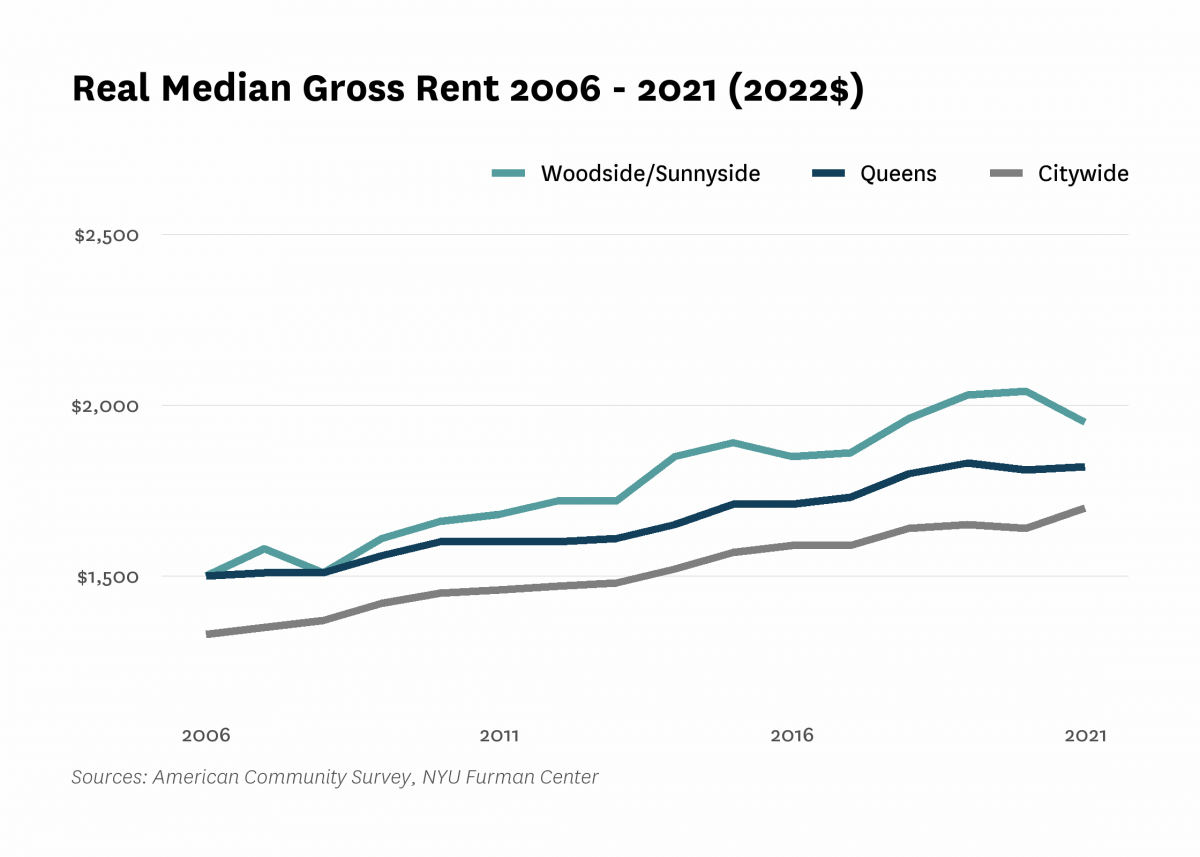
| Median rent, 2- and 3-bedrooms (2022$) | $1,810 | $2,000 | $2,150 | |||
| Median rent, all (2022$) | $1,330 | $1,500 | $1,660 | $2,030 | $1,950 | |
| Median rent, recent movers (2022$) | $1,810 | $2,230 | $2,480 | |||
| Median rent, studios and 1-bedrooms (2022$) | $1,430 | $1,690 | $1,840 | |||
| Change in collected rent (2019-2020) | -0.5% | |||||
| Affordability | ||||||
| Rental units affordable at 30% AMI (% of recently available units) | 0.9% | 1.5% | 1.8% | |||
| Rental units affordable at 80% AMI (% of recently available units) | 43.0% | 28.8% | 33.3% | |||
| Rental units affordable at 120% AMI (% of recently available units) | 91.4% | 72.9% | 70.2% | |||
| Rent Burden | ||||||
| Moderately rent-burdened households | 20.1% | 32.3% | 24.7% | 27.3% | ||
| Moderately rent-burdened households, low income | 36.0% | 41.6% | 41.6% | |||
| Moderately rent-burdened households, moderate income | 17.4% | 23.4% | 30.1% | |||
| Severely rent-burdened households | 21.1% | 24.0% | 22.2% | 20.4% | ||
| Severely rent-burdened households, low income | 45.7% | 39.5% | 38.4% | |||
| Severely rent-burdened households, moderate income | 0.9% | 1.3% | 1.2% | |||
| Rental Subsidy | ||||||
| Housing choice vouchers (% of occupied, privately owned rental units) | 0.9% | 0.6% | ||||
| Public housing (% of rental units) | 0.0% | |||||
Data Notes: See CoreData User Guide for more information about indicator definitions and methods.
Indicators: The rental vacancy rate, severe crowding rate, and the severely rent-burdened households indicators use five-year American Community Survey (ACS) estimates. Data under the 2010 heading comes from the 2006 – 2010 ACS, data under the 2019 heading comes from the 2015 – 2019 ACS and data under the 2021 heading comes from 2017 – 2021 ACS .
All content © 2005 – 2024 Furman Center for Real Estate and Urban Policy | Top of page | Contact Us