| Indicator | 2000 | 2006 | 2010 | 2019 | 2021 | 2022 |
|---|---|---|---|---|---|---|
| Population | ||||||
| Born in New York State | 50.5% | 48.5% | 48.5% | 45.0% | ||
| Disabled population | 5.0% | 7.0% | 9.4% | |||
| Foreign-born population | 30.7% | 32.2% | 30.1% | 23.7% | 26.4% | |
| Population | 123,117 | 127,013 | 119,323 | 128,327 | 138,614 | |
| Population aged 65+ | 9.6% | 9.5% | 9.1% | 13.6% | 11.1% | |
| Households | ||||||
| Households with children under 18 years old | 38.2% | 35.1% | 30.7% | 21.9% | 20.6% | |
| Single-person households | 32.2% | 33.2% | 33.4% | 37.2% | ||
| Race and Ethnicity | ||||||
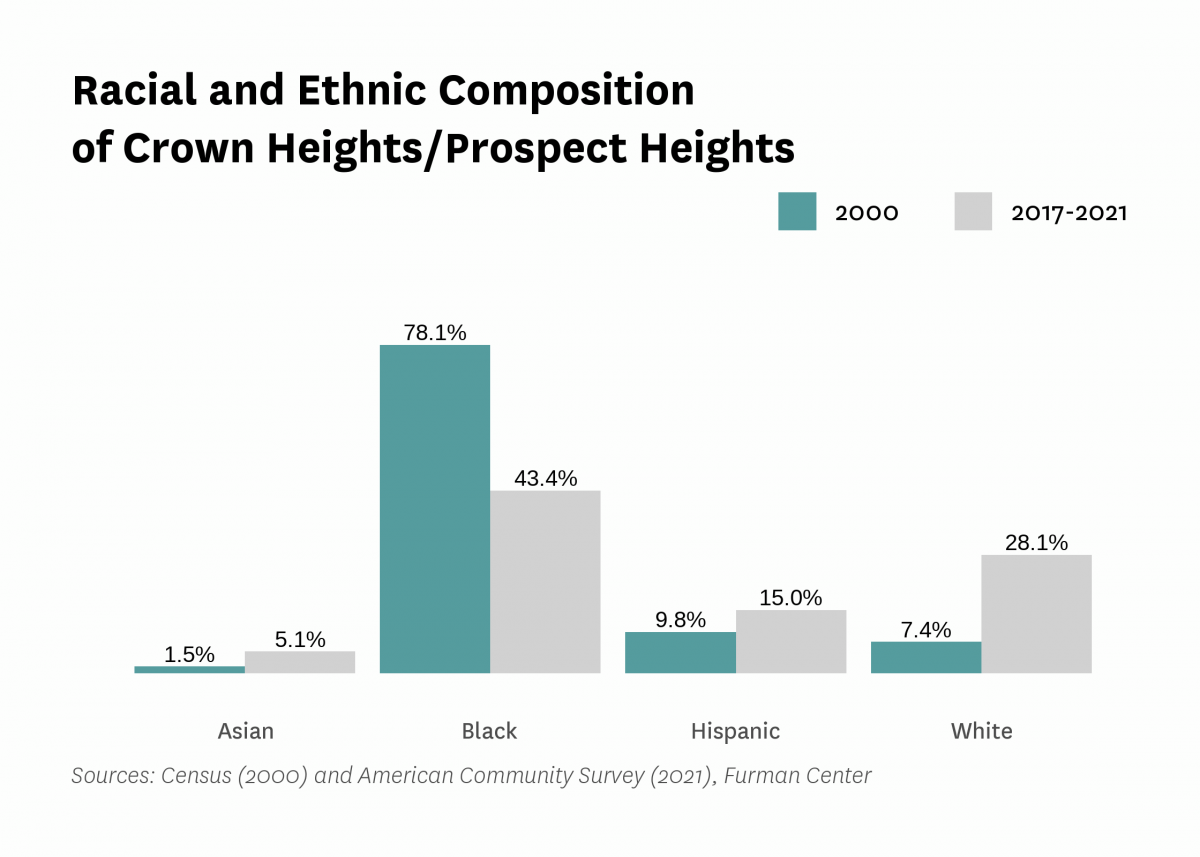
| Percent Asian | 1.5% | 2.0% | 3.3% | 3.2% | 5.1% | |
| Percent Black | 78.1% | 73.5% | 61.6% | 48.8% | 43.4% | |
| Percent Hispanic | 9.8% | 9.8% | 13.7% | 14.1% | 15.0% | |
| Percent white | 7.4% | 12.5% | 19.0% | 30.8% | 28.1% | |
| Racial diversity index | 0.37 | 0.43 | 0.56 | 0.65 | 0.71 | |
| Income and Poverty | ||||||
| Income diversity ratio | 6.9 | 6.3 | 7.1 | 7.6 | ||
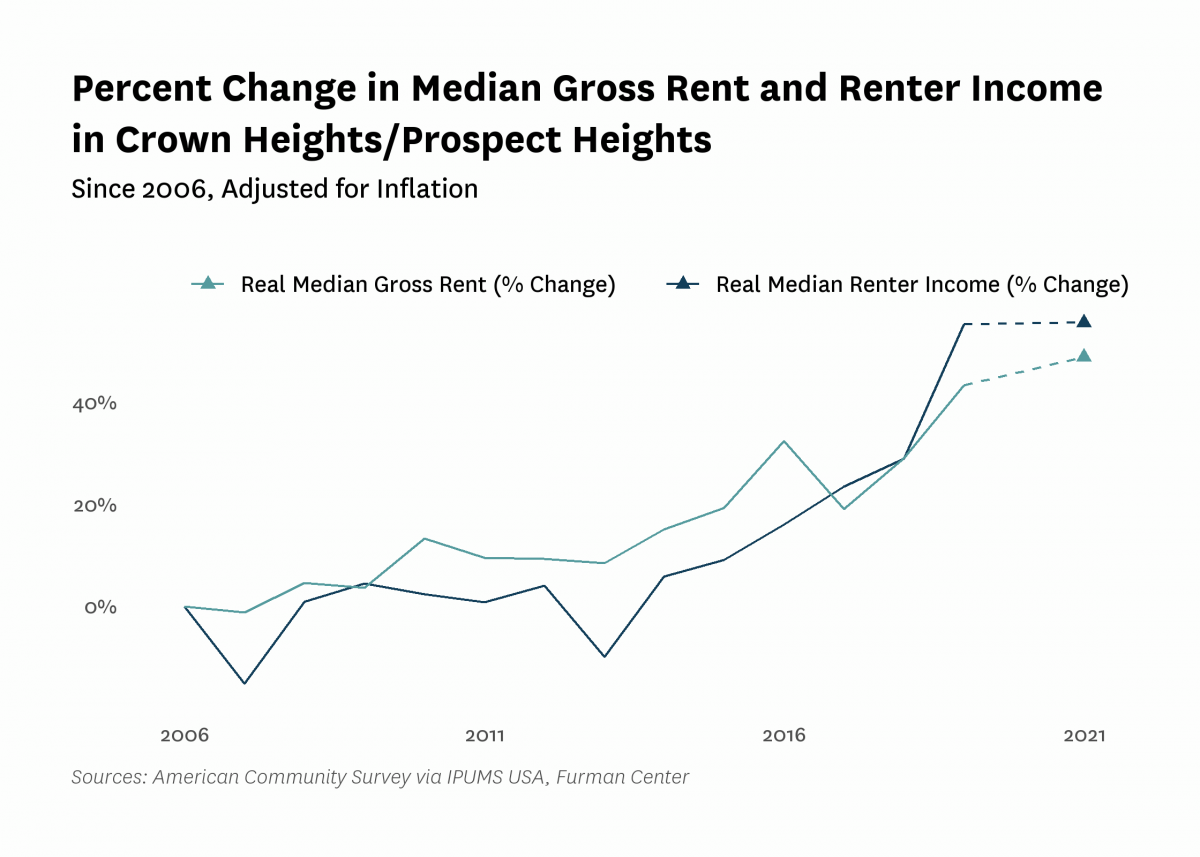
| Median household income (2022$) | $52,570 | $54,140 | $49,660 | $82,990 | $77,560 | |
| Median household income, homeowners (2022$) | $99,910 | $98,640 | $155,360 | $155,250 | ||
| Median household income, renters (2022$) | $44,170 | $45,240 | $68,590 | $68,740 | ||
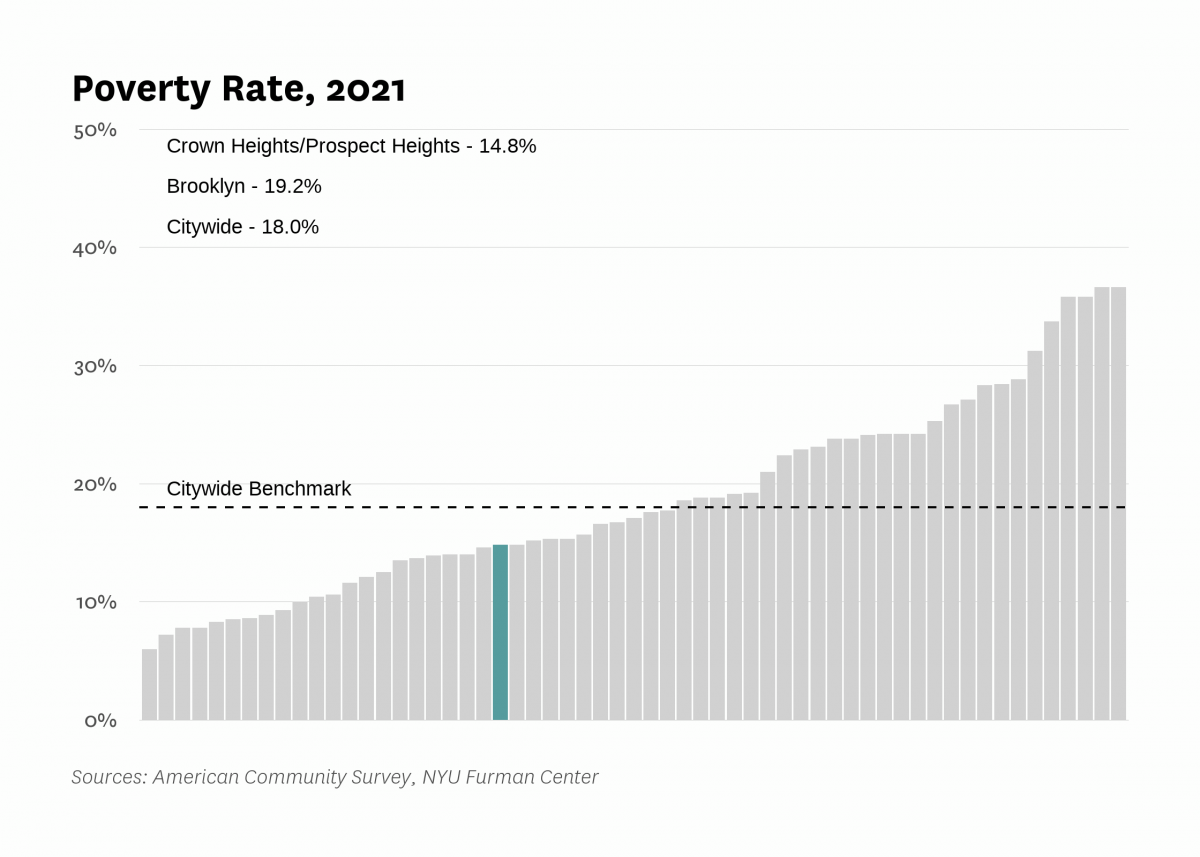
| Poverty rate | 28.2% | 22.9% | 25.9% | 15.9% | 14.8% | |
| Poverty rate, population aged 65+ | 26.2% | 15.7% | 17.1% | 13.1% | ||
| Poverty rate, population under 18 years old | 32.8% | 42.5% | 19.2% | 17.6% | ||
| Labor Market | ||||||
| Labor force participation rate | 65.9% | 66.4% | 67.9% | 70.4% | ||
| Population aged 25+ without a high school diploma | 20.0% | 16.1% | 11.1% | 10.9% | ||
| Unemployment rate | 14.67% | 12.74% | 10.09% | 4.12% | 10.48% | |
| Indicator | 2000 | 2006 | 2010 | 2019 | 2021 | 2022 |
|---|---|---|---|---|---|---|
| Housing Stock | ||||||
| Homeownership rate | 16.0% | 20.0% | 19.3% | 21.4% | 18.3% | |
| Housing units | 54,172 | 56,344 | 60,403 | 65,757 | ||
| Rental vacancy rate | 5.3% | 3.3% | 3.2% | |||
| Serious housing code violations (per 1,000 privately owned rental units) | 156.8 | 111.1 | 143.0 | 166.0 | 164.8 | |
| Severe crowding rate (% of renter households) | 2.7% | 2.4% | 2.0% | |||
| Total housing code violations (per 1,000 privately owned rental units) | 699.6 | 422.9 | 541.5 | 640.4 | 569.8 | |
| Finance - Distress | ||||||
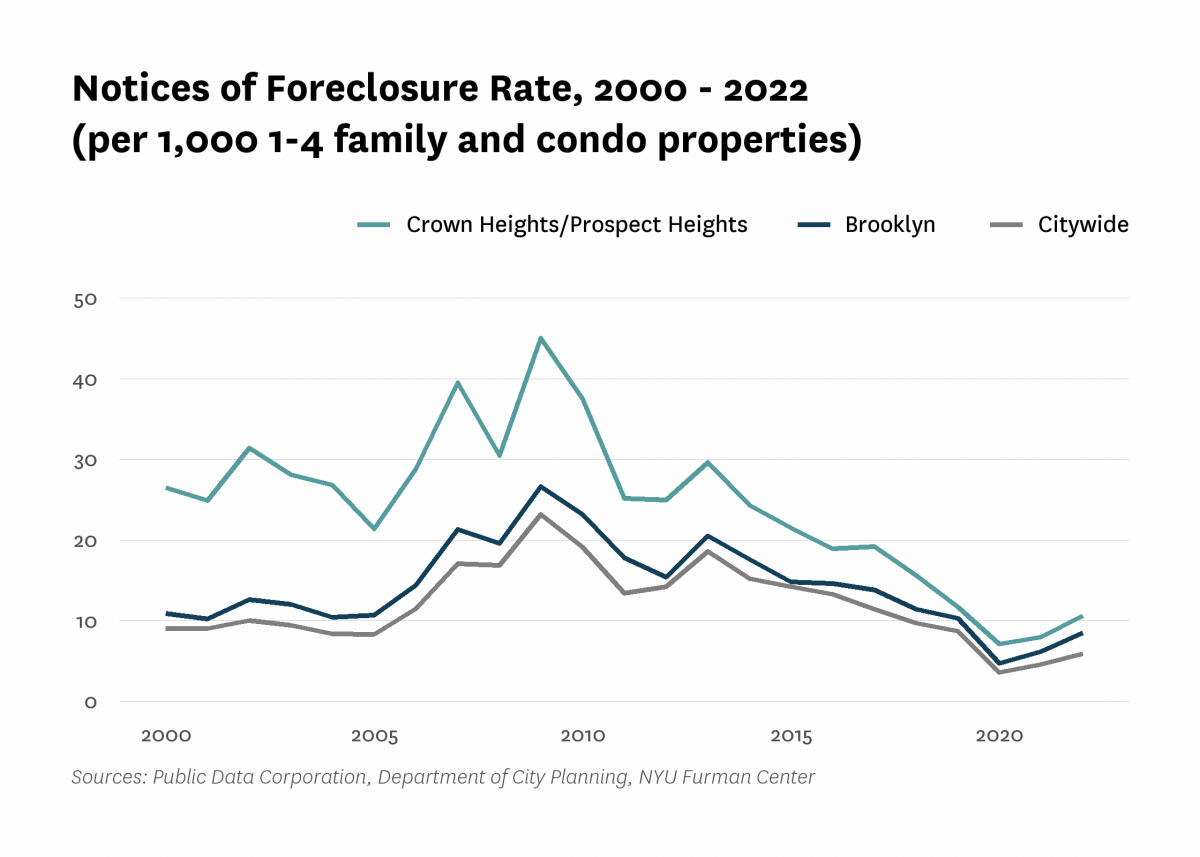
| Notices of foreclosure rate (per 1,000 1-4 family and condo properties) | 26.5 | 28.8 | 37.5 | 11.7 | 8.0 | 10.6 |
| Notices of foreclosure, all residential properties | 175 | 184 | 294 | 97 | 72 | 89 |
| Notices of foreclosure, initial, 1-4 family and condo properties | 88 | 120 | 132 | 37 | 17 | 33 |
| Notices of foreclosure, repeat, 1-4 family and condo properties | 26 | 27 | 88 | 42 | 38 | 41 |
| Pre-foreclosure notice rate (per 1,000 1-4 family and condo properties) | 48.0 | 23.6 | 42.1 | |||
| Pre-foreclosure notices, 1-4 family and condo properties | 324 | 164 | 293 | |||
| Properties entering REO, 1-4 family | 18 | 5 | 6 | |||
| Finance - Lending | ||||||
| FHA/VA-backed home purchase loans (% of home purchase loans) | 0.7% | 34.0% | 2.9% | 2.1% | ||
| Higher-cost home purchase loans (% of home purchase loans) | 32.1% | 0.3% | 2.1% | 1.0% | ||
| Higher-cost refinance loans (% of refinance loans) | 40.4% | 2.7% | 3.9% | 0.3% | ||
| Home purchase loan rate (per 1,000 properties) | 64.3 | 30.3 | 27.8 | 41.8 | ||
| Home purchase loans in LMI tracts (% of home purchase loans) | 68.9% | 3.8% | 38.7% | 43.5% | ||
| Home purchase loans to LMI borrowers (% of home purchase loans) | 2.1% | 59.0% | 1.2% | 1.2% | ||
| Refinance loan rate (per 1,000 properties) | 73.1 | 22.5 | 23.2 | 53.4 | ||
| Sales - Volume | ||||||
| Sales volume, 1 family building | 11 | 28 | 11 | 10 | 13 | 19 |
| Sales volume, 2-4 family building | 168 | 306 | 90 | 74 | 77 | 144 |
| Sales volume, 5+ family building | 59 | 83 | 38 | 16 | 23 | 32 |
| Sales volume, condominium | 25 | 130 | 162 | 140 | 210 | 200 |
| Sales volume, all property types | 263 | 547 | 301 | 240 | 323 | 395 |
| Sales - Median Prices | ||||||
| Median sales price per unit, 1 family building (2022$) | $339,880 | $797,490 | $449,380 | $1,672,440 | $1,824,960 | $1,800,000 |
| Median sales price per unit, 2-4 family building (2022$) | $168,810 | $374,740 | $280,060 | $533,090 | $717,960 | $665,280 |
| Median sales price per unit, 5+ family building (2022$) | $66,910 | $117,110 | $98,610 | $255,980 | $234,160 | $397,920 |
| Median sales price per unit, condominium (2022$) | $175,040 | $589,640 | $560,840 | $1,268,260 | $1,183,040 | $1,050,000 |
| Sales - Housing Price Index | ||||||
| Index of housing price appreciation, 1 family building | 100.0 | 273.8 | 196.6 | 669.9 | 676.3 | 836.7 |
| Index of housing price appreciation, 2-4 family building | 100.0 | 276.2 | 202.0 | 416.8 | 596.1 | 555.8 |
| Index of housing price appreciation, 5+ family building | 100.0 | 225.7 | 199.8 | 673.2 | 532.1 | 613.1 |
| Index of housing price appreciation, condominium | 100.0 | 283.2 | 287.0 | 543.2 | 561.7 | 616.4 |
| Index of housing price appreciation, all property types | 100.0 | 265.0 | 229.3 | 464.0 | 524.5 | 556.6 |
| Subsidized Housing | ||||||
| Total number of subsidized properties (properties) | 517 | |||||
| HUD Financing or Insurance (properties) | 9 | |||||
| HUD Financing or Insurance (units) | 193 | |||||
| HUD Project-based Rental Assistance Program (properties) | 36 | |||||
| HUD Project-based Rental Assistance Program (units) | 1,580 | |||||
| Low Income Housing Tax Credit (properties) | 79 | |||||
| Low Income Housing Tax Credit (units) | 2,185 | |||||
| Public Housing (properties) | 33 | |||||
| Public Housing (units) | 3,183 | |||||
| Mitchell-Lama (properties) | 2 | |||||
| Mitchell-Lama (units) | 240 | |||||
| 421-a Tax Exemption (properties) | 140 | |||||
| 421-a Tax Exemption (units) | 3,905 | |||||
| 420-c Tax Exemption (properties) | 116 | |||||
| 420-c Tax Exemption (units) | 2,247 | |||||
| NYC Housing Production Programs and Zoning Incentives or Requirements (properties) | 204 | |||||
| Eligible to expire from housing programs between 2023 and 2028 (properties) | 43 | |||||
| Eligible to expire from housing programs between 2023 and 2028 (units) | 1,287 | |||||
| Eligible to expire from housing programs between 2029 and 2038 (properties) | 26 | |||||
| Eligible to expire from housing programs between 2029 and 2038 (units) | 505 | |||||
| Eligible to expire from housing programs in 2039 and later (properties) | 37 | |||||
| Eligible to expire from housing programs in 2039 and later (units) | 1,697 | |||||
| Indicator | 2000 | 2006 | 2010 | 2019 | 2021 | 2022 |
|---|---|---|---|---|---|---|
| Density | ||||||
| Population density (1,000 persons per square mile) | 57.2 | 53.7 | 57.8 | 62.4 | ||
| Development | ||||||
| Units authorized by new residential building permits | 152 | 24 | 10 | 319 | 491 | 1,510 |
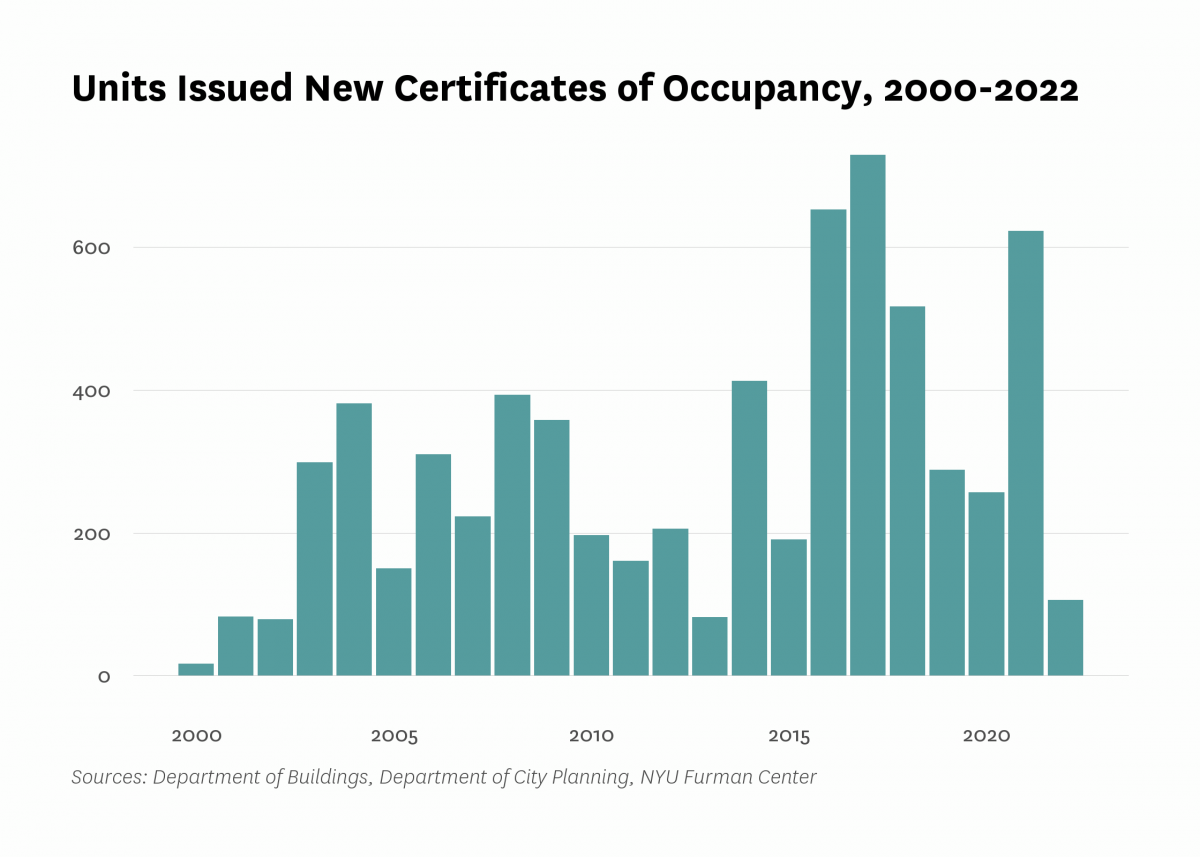
| Units issued new certificates of occupancy | 17 | 310 | 197 | 288 | 623 | 106 |
| Indicator | 2000 | 2006 | 2010 | 2019 | 2021 | 2022 |
|---|---|---|---|---|---|---|
| Commute | ||||||
| Car-free commute (% of commuters) | 78.8% | 79.8% | 86.8% | 85.4% | 75.8% | |
| Mean travel time to work (minutes) | 45.0 | 40.5 | 39.4 | 43.6 | 43.9 | |
| Crime and Incarceration | ||||||
| Serious crime rate (per 1,000 residents) | 14.7 | 14.0 | 10.5 | 9.3 | 12.4 | |
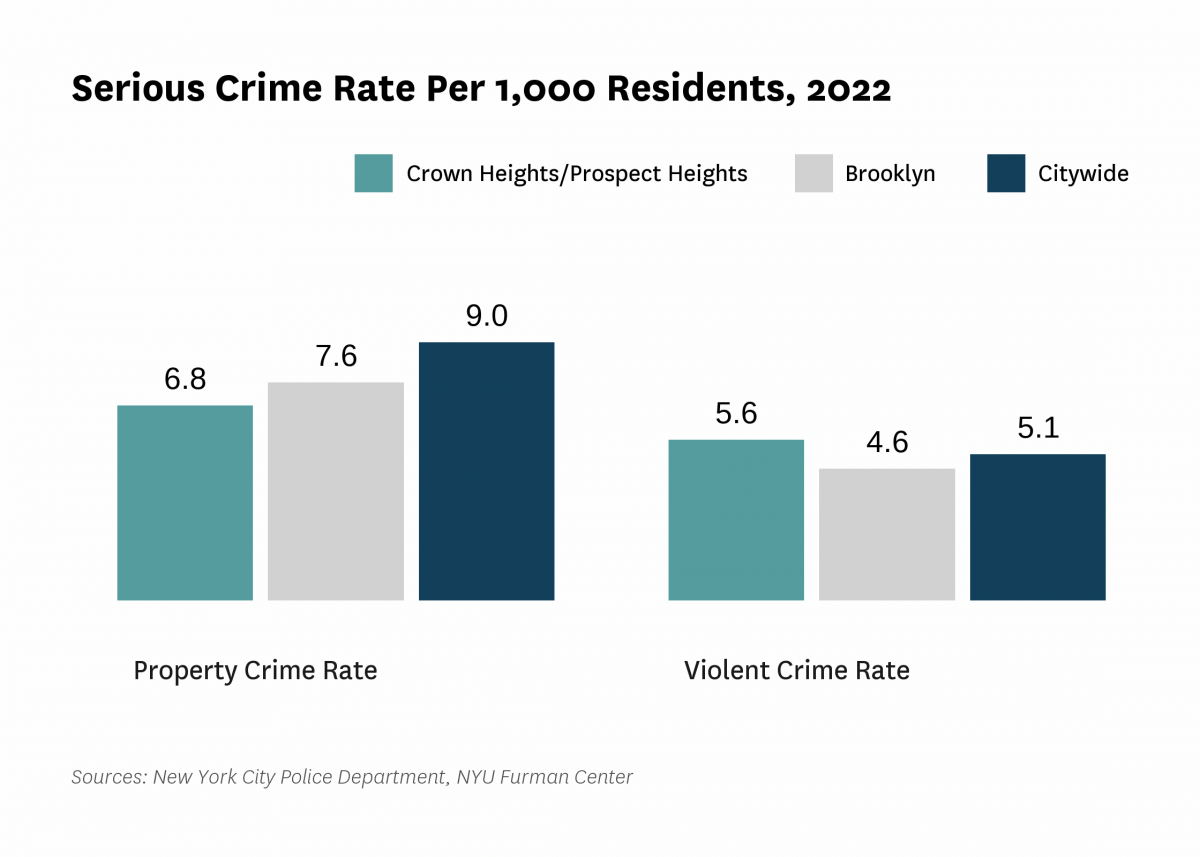
| Serious crime rate, property (per 1,000 residents) | 8.1 | 7.7 | 5.6 | 4.9 | 6.8 | |
| Serious crime rate, violent (per 1,000 residents) | 6.6 | 6.3 | 4.8 | 4.3 | 5.6 | |
| Schools | ||||||
| Students performing at grade level in English language arts, 4th grade | 51.6% | 45.6% | ||||
| Students performing at grade level in math, 4th grade | 45.5% | 36.6% | ||||
| Indicator | 2000 | 2006 | 2010 | 2019 | 2021 | 2022 |
|---|---|---|---|---|---|---|
| Median Rent | ||||||
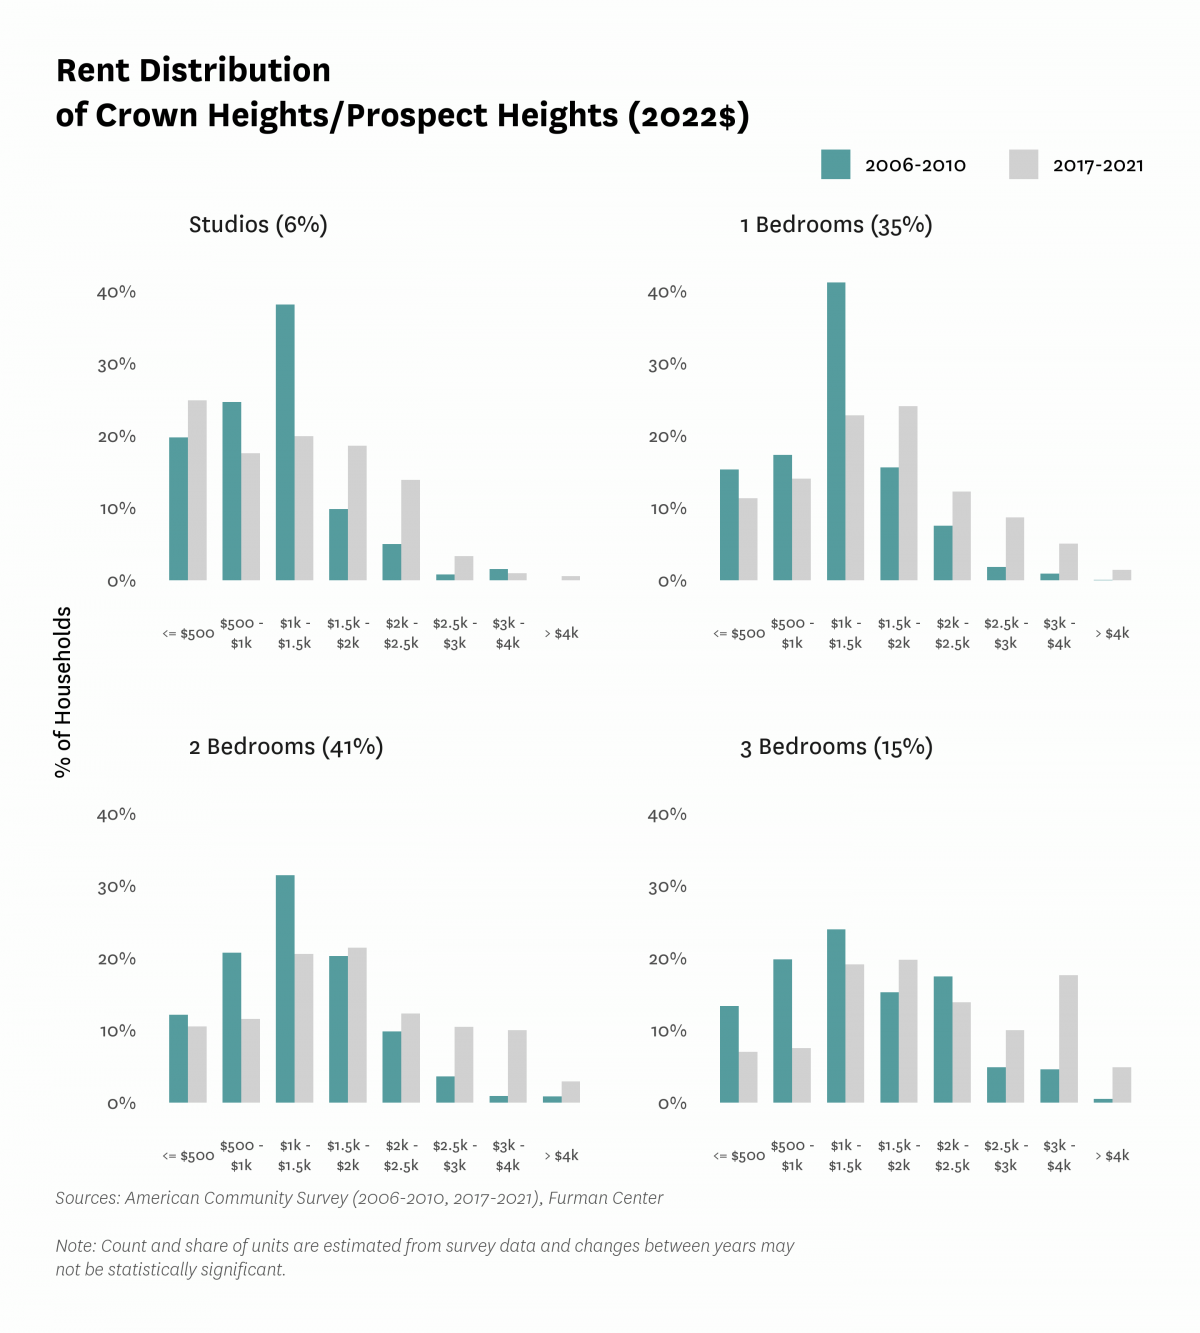
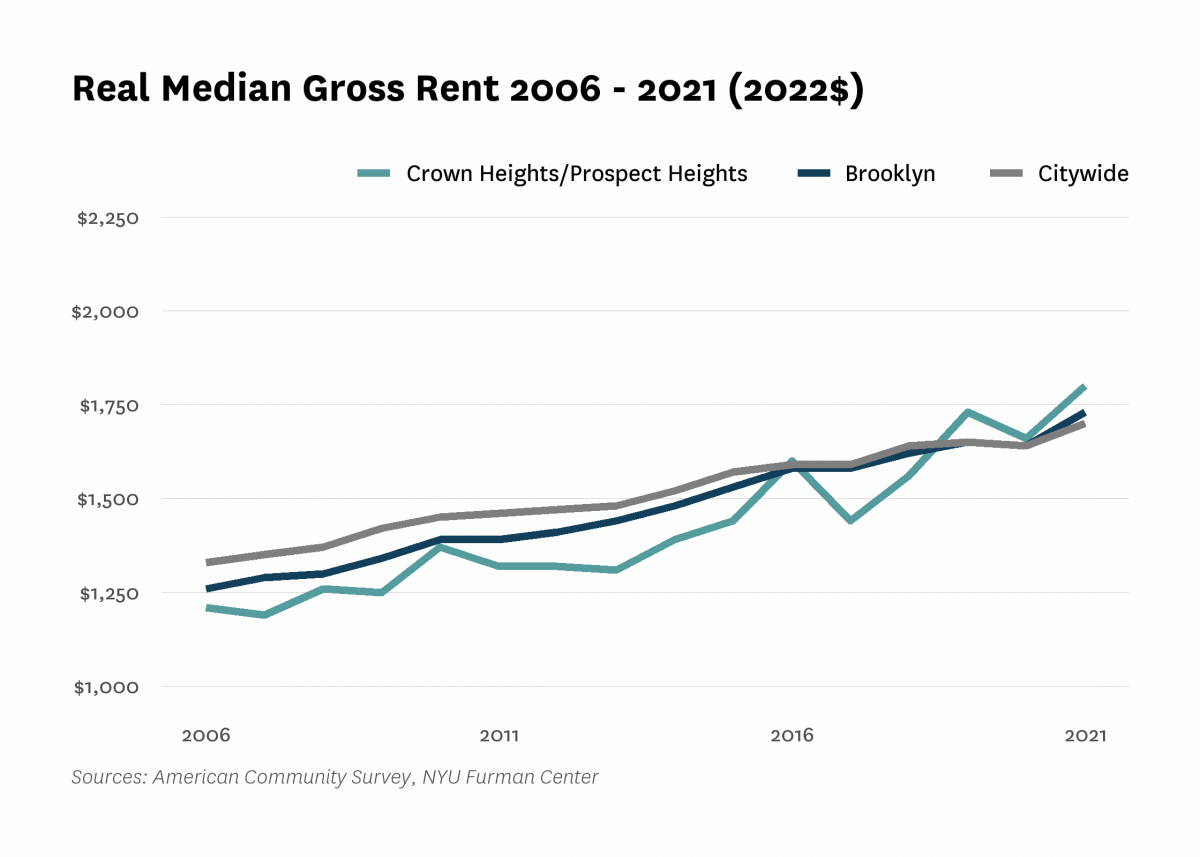
| Median rent, 2- and 3-bedrooms (2022$) | $1,330 | $1,560 | $1,770 | |||
| Median rent, all (2022$) | $1,020 | $1,210 | $1,370 | $1,730 | $1,800 | |
| Median rent, recent movers (2022$) | $1,630 | $2,260 | $2,510 | |||
| Median rent, studios and 1-bedrooms (2022$) | $1,240 | $1,380 | $1,490 | |||
| Change in collected rent (2019-2020) | -0.8% | |||||
| Affordability | ||||||
| Rental units affordable at 30% AMI (% of recently available units) | 11.9% | 5.8% | 5.5% | |||
| Rental units affordable at 80% AMI (% of recently available units) | 63.1% | 37.2% | 33.0% | |||
| Rental units affordable at 120% AMI (% of recently available units) | 92.9% | 84.0% | 78.0% | |||
| Rent Burden | ||||||
| Moderately rent-burdened households | 23.5% | 29.2% | 22.7% | 24.4% | ||
| Moderately rent-burdened households, low income | 29.4% | 32.1% | 31.6% | |||
| Moderately rent-burdened households, moderate income | 19.2% | 23.3% | 23.8% | |||
| Severely rent-burdened households | 24.7% | 27.7% | 26.8% | 25.0% | ||
| Severely rent-burdened households, low income | 42.7% | 42.9% | 42.5% | |||
| Severely rent-burdened households, moderate income | 0.2% | 1.0% | 1.3% | |||
| Rental Subsidy | ||||||
| Housing choice vouchers (% of occupied, privately owned rental units) | 6.8% | 5.3% | ||||
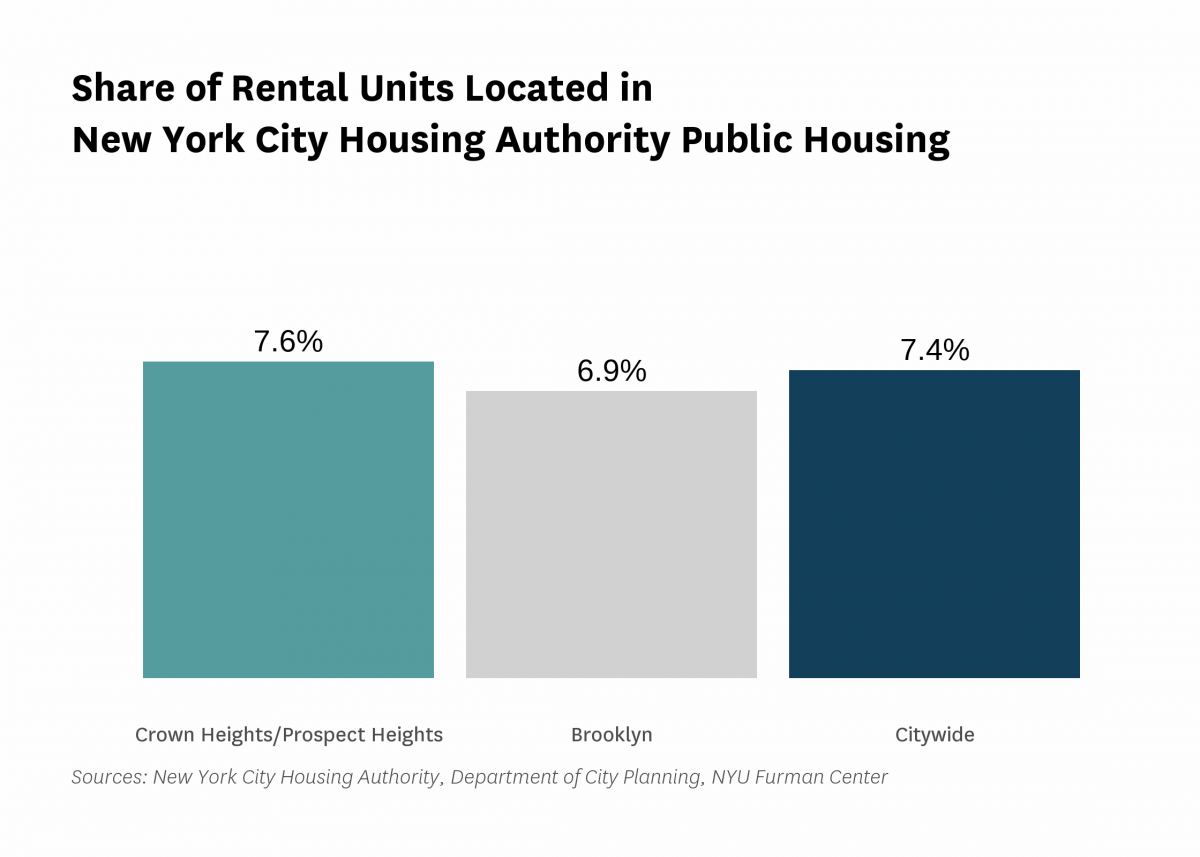
| Public housing (% of rental units) | 7.6% | |||||
Data Notes: See CoreData User Guide for more information about indicator definitions and methods.
Indicators: The rental vacancy rate, severe crowding rate, and the severely rent-burdened households indicators use five-year American Community Survey (ACS) estimates. Data under the 2010 heading comes from the 2006 – 2010 ACS, data under the 2019 heading comes from the 2015 – 2019 ACS and data under the 2021 heading comes from 2017 – 2021 ACS .
All content © 2005 – 2024 Furman Center for Real Estate and Urban Policy | Top of page | Contact Us